Main Content

getDataVariable

Get data variable values

Since R2020a

Description

datavariable = getDataVariable(pd) returns the values of the data points in the specified propagation data object. The data is processed such that the missing values are removed and duplicate location data are replaced with mean values.

[datavariable,lat,lon] = getDataVariable(pd) returns the location coordinates of the data points in the propagation data object.

[___] = getDataVariable(pd,varname) returns the values of the data points corresponding to the varname variable.

example

Examples

collapse all

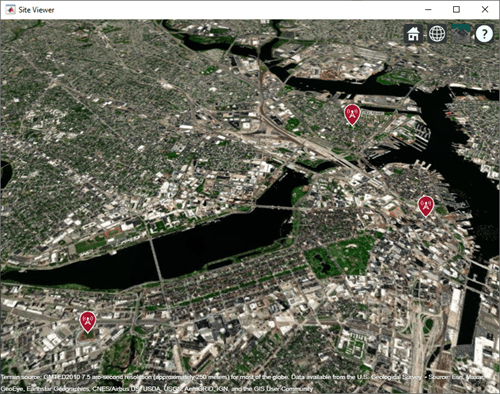
Define names and locations of sites around Boston.

names = ["Fenway Park","Faneuil Hall","Bunker Hill Monument"];
lats = [42.3467,42.3598,42.3763];
lons = [-71.0972,-71.0545,-71.0611];

Create an array of transmitter sites.

txs = txsite("Name",names,...
       "Latitude",lats,...
       "Longitude",lons, ...
       "TransmitterFrequency",2.5e9);
show(txs)

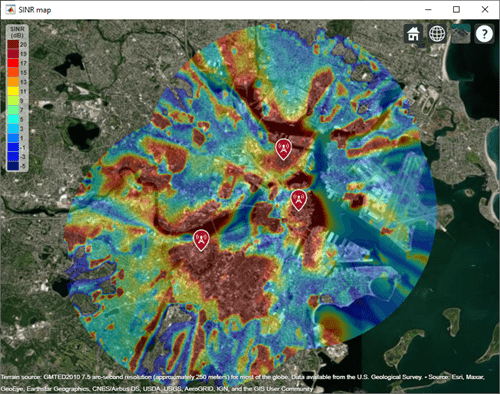
Create a signal-to-interference-plus-noise-ratio (SINR) map, where signal source for each location is selected as the transmitter site with the strongest signal.

sv1 = siteviewer("Name","SINR map");
sinr(txs,"MaxRange",5000)

Return SINR propagation data.

pd = sinr(txs,"MaxRange",5000);
[sinrDb,lats,lons] = getDataVariable(pd,"SINR"); 

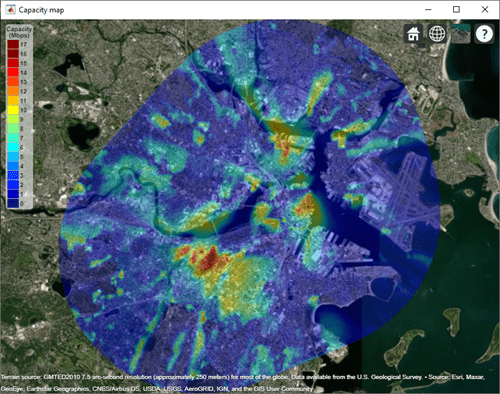
Compute capacity using the Shannon-Hartley theorem.

bw = 1e6; % Bandwidth is 1 MHz
sinrRatio = 10.^(sinrDb./10); % Convert from dB to power ratio
capacity = bw*log2(1+sinrRatio)/1e6; % Unit: Mbps

Create new propagation data for the capacity map and display the contour plot.

pdCapacity = propagationData(lats,lons,"Capacity",capacity);
sv2 = siteviewer("Name","Capacity map");
legendTitle = "Capacity" + newline + "(Mbps)";
contour(pdCapacity,"LegendTitle",legendTitle);

Input Arguments

collapse all

Propagation data, specified as a propagationData object.

Variable name in the data table, specified as a character vector or a string scalar. This variable name must correspond to a variable with numeric data other than the latitude or longitude data.

Output Arguments

collapse all

Values of the data points in the propagation data object, returned as a column vector.

Latitudes of the data points, returned as an M-by-1 vector with each element unit in degrees.

Longitudes of the data points, returned as an M-by-1 matrix with each element unit in degrees. The output is wrapped so that the values are in the range [–180, 180].

Version History

Introduced in R2020a
See Also

Functions

Objects