visualize
Description
visualize( plots the octave spectrum
computed by the o)octaveSpectrumEstimator
System object™. The visualization is updated with the computed spectrum as the simulation
progresses.
Examples
Create a dsp.AudioFileReader to stream an audio file for processing. Create an audioDeviceWriter to play the audio as you stream it.
reader = dsp.AudioFileReader("FunkyDrums-44p1-stereo-25secs.mp3");
player = audioDeviceWriter(SampleRate=reader.SampleRate);
Create an octaveSpectrumEstimator object with the same sample rate as the file reader.
o = octaveSpectrumEstimator(reader.SampleRate)
o =
  octaveSpectrumEstimator with properties:

            SampleRate: 44100
             Bandwidth: '1/3 octave'
    FrequencyWeighting: 'A-weighting'
         TimeWeighting: 'fast'
        FrequencyRange: [22 22050]
           FilterOrder: 2
    ReferenceFrequency: 1000
       OctaveRatioBase: 10
              ApplyLog: false
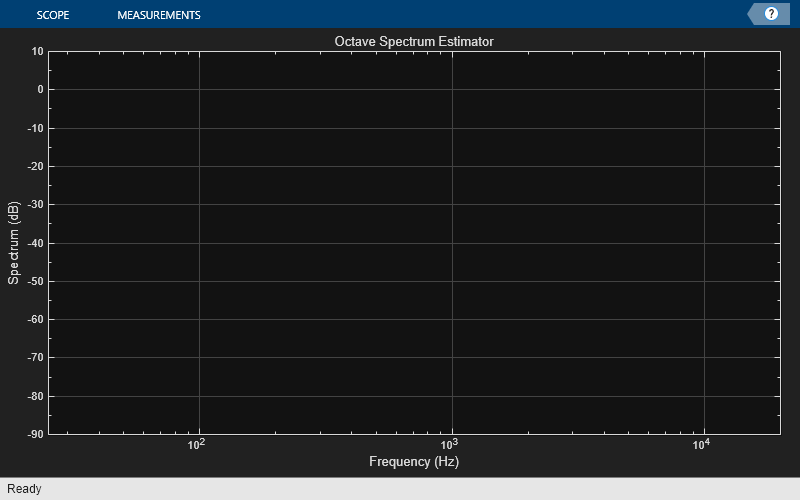
Call visualize on the object to open a visualizer to display the spectrum.
visualize(o)
In a streaming loop:
Read in a frame of audio data.
Compute the octave-band spectrum
Play the audio with the device writer.
See the visualizer update with the measured spectrum as the audio plays.
while ~isDone(reader)
    audioIn = reader();
    p = o(audioIn);
    player(audioIn);
end
Create a dsp.AudioFileReader to stream an audio file for processing. Create an audioDeviceWriter to play the audio as you stream it.
reader = dsp.AudioFileReader("FunkyDrums-44p1-stereo-25secs.mp3");
player = audioDeviceWriter(SampleRate=reader.SampleRate);
Create an octaveSpectrumEstimator object with the same sample rate as the file reader and set the Bandwidth to 1 octave.
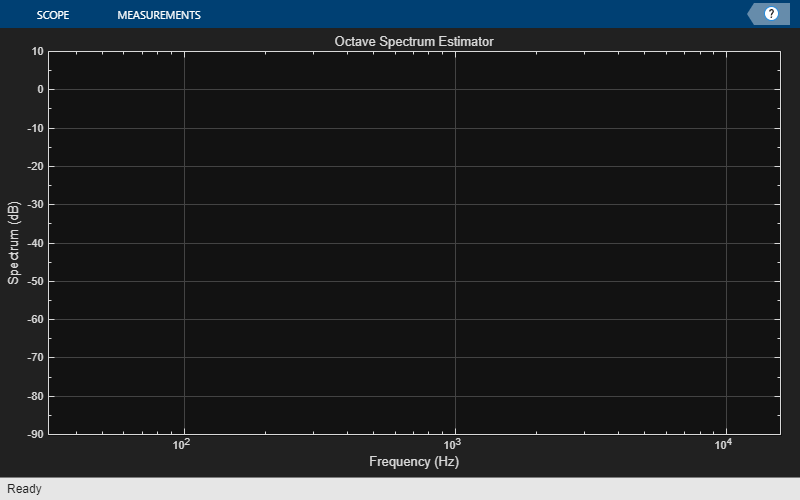
o = octaveSpectrumEstimator(reader.SampleRate,Bandwidth="1 octave");Call visualize on the object to open a visualizer to display the spectrum.
visualize(o)
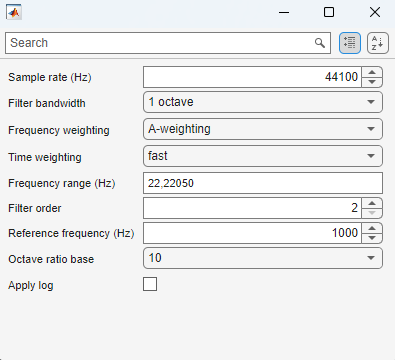
Call parameterTuner to open a UI to tune parameters of the octaveSpectrumEstimator while streaming.
parameterTuner(o)
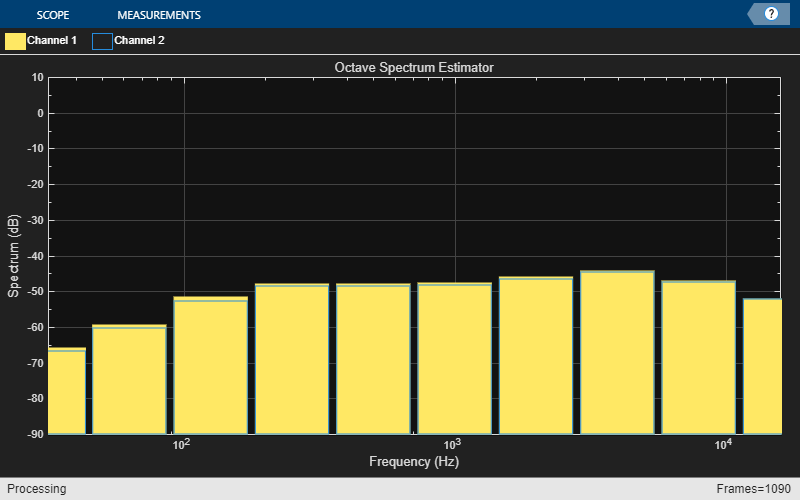
In a streaming loop:
Read in a frame of audio data.
Compute the octave-band spectrum
Play the audio with the device writer.
Adjust the properties in the parameterTuner UI while streaming.
while ~isDone(reader)
    audioIn = reader();
    p = o(audioIn);
    player(audioIn);
end
Input Arguments
Output Arguments
More About
Version History
Introduced in R2024b