Build an Impulse Response Measurement App
R2026bThis example shows how to build an app that measures the impulse response of an audio system. The app generates a swept-sine excitation using sweeptone, plays and records simultaneously using audiostreamer in full-duplex mode, and estimates the impulse response using impzest. A uiaudiometer component provides real-time visual feedback during the measurement.
If you need a full-featured impulse response measurement tool, use the Impulse Response Measurer app shipped with Audio Toolbox. This example is instead a starting point for building your own custom measurement app: it demonstrates how callback-driven audio I/O enables responsive app design, with audio processing in the background while the UI remains interactive.
Run the App
The complete working app is included with this example as AudioMeasureApp.m, a programmatic MATLAB app class. Open it in the Editor to inspect the implementation, or run it directly at the command line:
AudioMeasureApp
The rest of this example walks through the key design decisions behind the app.
Create App
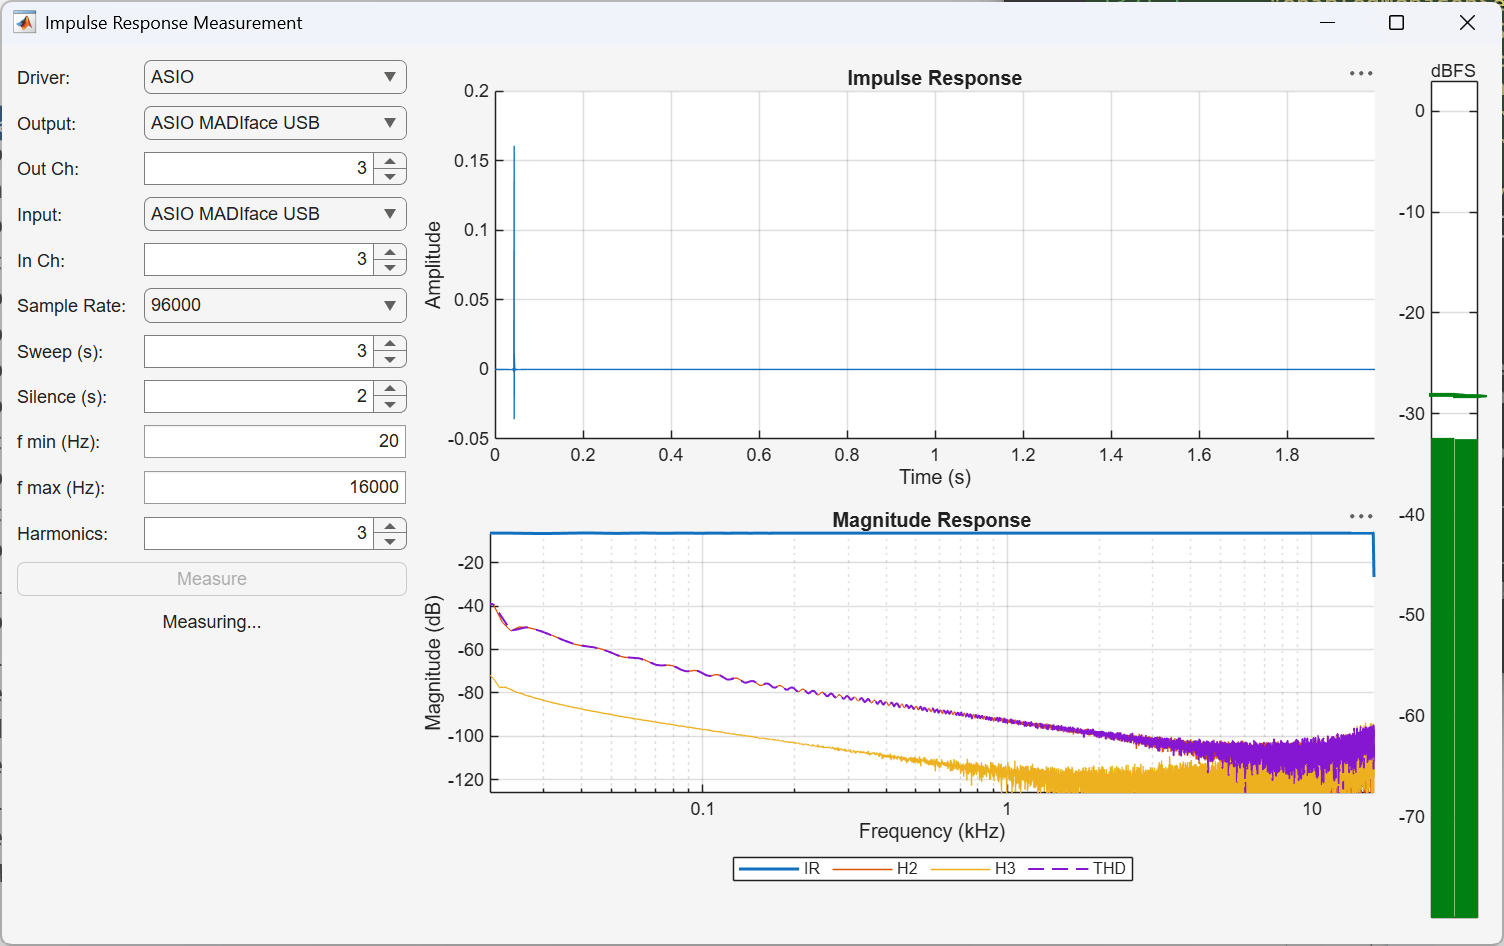
The app uses a uigridlayout with three columns: configuration controls on the left, plots in the center, and a vertical audio meter on the right. The center column stacks two axes (impulse response on top, frequency response below) so both the time-domain and frequency-domain views appear together after each measurement. A warning label under the status text surfaces any parameter-quality warnings from impzest.
Select Audio Devices
Populate the driver dropdown using audiostreamer.getDrivers. When the user selects a driver, update the player and recorder dropdowns with devices available for that driver.
function driverChanged(app)
    driver = app.DriverDropDown.Value;
    app.PlayerDropDown.Items = audiostreamer.getPlayerNames(driver);
    app.RecorderDropDown.Items = audiostreamer.getRecorderNames(driver);
end
The full driverChanged in AudioMeasureApp.m also caches the device list from audiostreamer.getAudioDevices and calls playerChanged/recorderChanged to refresh the input- and output-channel spinner limits for the newly selected devices.
On Windows, the app also selects ASIO as the default driver when an ASIO device is available.
if any(drivers == "ASIO") && ~isempty(audiostreamer.getRecorderNames("ASIO"))
    app.DriverDropDown.Value = "ASIO";
end
Configure Excitation Signal
The app uses sweeptone to generate an exponential swept sine followed by a silent tail. The sweep rises logarithmically from f min to f max; the silence lets the system under test ring out before recording ends. Setting SweepFrequencyRange concentrates excitation energy in the band of interest instead of spanning all the way to Nyquist. The same range is passed to impzest, which uses it to deconvolve the linear impulse response and, when NumHarmonics > 1, to separate higher-order harmonic responses.
function createExcitation(app)
    app.Excitation = sweeptone(app.SweepDurSpinner.Value, ...
        app.SilenceDurSpinner.Value, ...
        app.SampleRate, ...
        SweepFrequencyRange=app.FrequencyRange);
end
Run Measurement
When the user clicks Measure, the app creates an audiostreamer in full-duplex mode with ConstantLatency set to "dropPlayer". This ensures repeatable latency between output and input, which is required for accurate impulse response estimation with impzest.
function measureButtonPushed(app)
    createExcitation(app);
    release(app.RecordingSink);
    app.RecordingSink.Capacity = size(app.Excitation, 1) + 16384;
    release(app.LevelMeter);
    app.LevelMeter.SampleRate = app.SampleRate;

    if ~isempty(app.Streamer)
        release(app.Streamer);
    end
    app.Streamer = audiostreamer("full-duplex", app.SampleRate, ...
        Driver=app.DriverDropDown.Value, ...
        Player=app.PlayerDropDown.Value, ...
        Recorder=app.RecorderDropDown.Value, ...
        PlayerChannels=app.OutputChSpinner.Value, ...
        RecorderChannels=app.InputChSpinner.Value, ...
        ConstantLatency="dropPlayer");

    app.Streamer.RecorderFcn = @(obj, ~) recorderCallback(app, obj);
    app.Streamer.RecorderMinSamples = 1024;
    app.Streamer.PlayerCompletedFcn = @(~, ~) measurementDone(app);

    app.IsMeasuring = true;
    app.MeasureButton.Enable = "off";
    app.StatusLabel.Text = "Measuring...";
    app.WarningLabel.Text = "";
    playrec(app.Streamer, app.Excitation);
end
Because the app drives a live level meter during the measurement, it uses two callbacks: RecorderFcn consumes recorded samples as they arrive, and PlayerCompletedFcn processes the full recording at the end. The RecorderFcn callback reads new samples, feeds the audioLevelMeter to compute levels (which are then displayed on the uiaudiometer component), and accumulates the data in a dsp.AsyncBuffer so the completed callback still has the full signal to analyze.
function recorderCallback(app, obj)
    if ~app.IsMeasuring
        return
    end
    data = read(obj);
    write(app.RecordingSink, data);
    levels = app.LevelMeter(data);
    app.Meter.Value = levels;
end
When the player finishes, PlayerCompletedFcn is called. The callback reads the accumulated recording, then calls impzest to estimate the impulse response and render the frequency response into the second axes via the Parent name-value argument. NumHarmonics controls the number of harmonic responses impzest separates from the linear response. If impzest issues a parameter-quality warning (for example, when the sweep is too short for the requested harmonic separation), the app captures it with lastwarn and displays it in the warning label.
function measurementDone(app)
    if isempty(app.Streamer)
        return
    end
    app.IsMeasuring = false;
    drawnow limitrate

    y = read(app.RecordingSink);
    lastwarn("");
    [app.ImpulseResponse, ~] = impzest(app.Excitation, y, ...
        SampleRate=app.SampleRate, ...
        SweepFrequencyRange=app.FrequencyRange, ...
        NumHarmonics=app.NumHarmSpinner.Value, ...
        Parent=app.UIAxesFR);
    app.WarningLabel.Text = lastwarn;

    plotIR(app);
    app.MeasureButton.Enable = "on";
    app.StatusLabel.Text = "Done";
    app.Meter.Value = -80;
end
Visualize Impulse Response
Plot the impulse response in the time domain on the top axes. The time axis is derived from the sample rate. The frequency-response plot on the bottom axes is produced directly by impzest in measurementDone above, using the Parent name-value argument to route the convenience plot into UIAxesFR. That plot shows the linear response, individual harmonics (H2, H3, ...), and total harmonic distortion (THD) on a log-frequency axis.
function plotIR(app)
    ir = app.ImpulseResponse;
    t = (0:size(ir,1)-1) / app.SampleRate;
    plot(app.UIAxesIR, t, ir);
    xlabel(app.UIAxesIR, "Time (s)");
    ylabel(app.UIAxesIR, "Amplitude");
    title(app.UIAxesIR, "Impulse Response");
    xlim(app.UIAxesIR, "tight");
    grid(app.UIAxesIR, "on");
end
Clean Up Audio Resources
When the app closes, it stops audio activity cleanly before tearing down the UI. The IsMeasuring flag is cleared first so any in-flight RecorderFcn callbacks return immediately rather than touching app properties that are about to be deleted. The Streamer property is then cleared before calling release. This serves the same purpose for any PlayerCompletedFcn callback that might still be invoked after teardown begins: measurementDone checks for an empty Streamer and returns early. Finally, release on the audiostreamer frees the audio device so a subsequent app launch can acquire it.
function delete(app)
    app.IsMeasuring = false;
    streamer = app.Streamer;
    app.Streamer = [];
    if ~isempty(streamer)
        try
            release(streamer);
        catch
        end
    end
    if isvalid(app.UIFigure)
        delete(app.UIFigure);
    end
end
See Also
audiostreamerimpzestsweeptoneuiaudiometer

