View Compilation Errors When Running Polyspace Static Analysis
If a Polyspace® static analysis run fails to reach completion, you can view error information in the log files of the analysis. Based on the error information, you can either fix your source code, add missing files or change analysis options to get past the error.
Check If All Files Compiled
If a function or file in your source code fails to compile, the analysis continues with the remaining files. However some checkers that depend on data propagation across the non-compiling functions might show unexpected results. To determine if all files compiled:
After opening the project overview dashboard showing your results, select Defects (Bug Finder) or Run-time Checks (Code Prover) on the toolstrip to open the corresponding dashboard.
For more information on the dashboards, see Dashboard in Polyspace Platform User Interface.
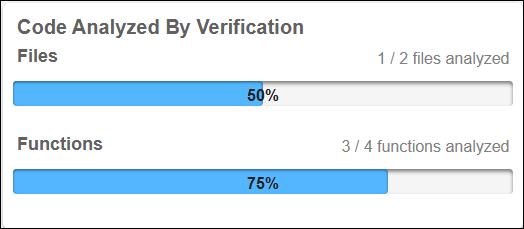
Note the number of files and functions analyzed in the Code Analyzed by Verification graph. If all files and functions are not analyzed, it is possible that there were compilation errors in the sources.
For instance, the following graph shows that one function in one file was not analyzed.
Note that in Code Prover, there can be reasons other than compilation errors why a function is not analyzed. See Reasons for Unchecked Code in Polyspace Code Prover Results (Polyspace Code Prover).
Look for actual compilation errors and warnings in the analysis log.
For more information, see Locate Analysis Log and Search for Errors.
To make sure that all files compiled before you review results, follow these steps:
Enable the option
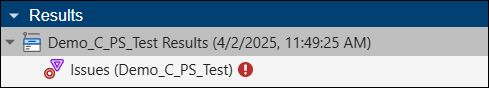
Stop analysis if a file does not compile (-stop-if-compile-error).If a compilation error occurs in any of the files, the analysis stops. If you are running static analysis in the Polyspace Platform user interface, you see an exclamation mark on the Results pane next to the Issues node (Bug Finder) or RTE node (Code Prover).
Alternatively, you can enable the defect checker File does not
compile to see non-compiling files as analysis results in Bug
Finder.
Locate Analysis Log and Search for Errors
Depending on how you are running static analysis, you can locate the analysis logs using one of these methods:
If you run static analysis in the Polyspace Platform user interface, the running analysis log is displayed in a dedicated pane. Note that the static analysis run logs are shown in a different pane than the Logs pane, which captures issues such as test validation errors and build errors. If you close the pane for the analysis log, you can reopen it. Right-click the result in the Results pane that was created during the analysis and select Open Run Log.
If you run static analysis at the command line, you can find the analysis log in the results folder. The log file is named
Polyspace_. For more information about the results folder and the files Polyspace generates, see Artifacts and Results Generated by Polyspace Platform Projects.release_project_date-time.log
Warnings are marked in orange and errors are marked in red. You can also search the analysis log for the following:
Lines beginning with
error:for compilation errors.Lines beginning with
warning:for compilation warnings.
See Also
Stop analysis if a file
                does not compile (-stop-if-compile-error)
| File does not
compile