针对回归训练卷积神经网络
此示例说明如何训练卷积神经网络来预测手写数字的旋转角度。
回归任务涉及预测连续数值而不是离散类标签。此示例为回归构造卷积神经网络架构,训练网络,并使用经过训练的网络来预测旋转手写数字的角度。
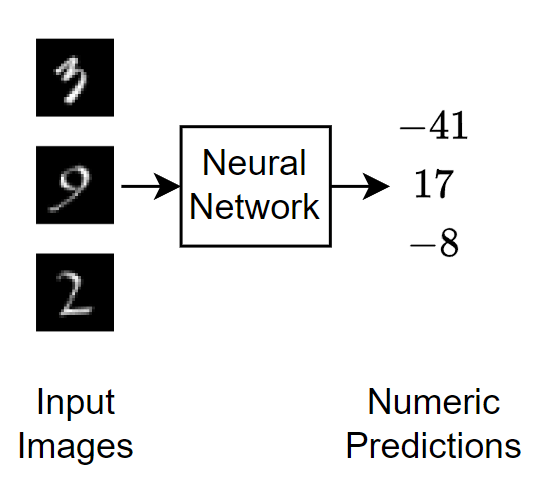
下图说明通过回归神经网络的图像数据流。
加载数据
数据集包含手写数字的合成图像以及每个图像的旋转角度(以度为单位)。
分别从 MAT 文件 DigitsDataTrain.mat 和 DigitsDataTest.mat 中加载训练数据和测试数据。变量 anglesTrain 和 anglesTest 是以度为单位的旋转角度。训练数据集和测试数据集各包含 5000 个图像。
load DigitsDataTrain
load DigitsDataTest
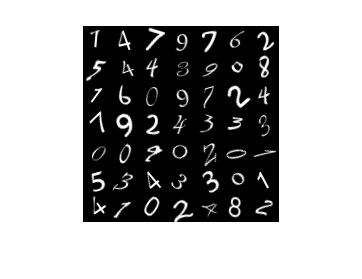
显示一些训练图像。
numObservations = size(XTrain,4);
idx = randperm(numObservations,49);
I = imtile(XTrain(:,:,:,idx));
figure
imshow(I);
使用 trainingPartitions 函数将 XTrain 和 anglesTrain 分区为训练分区和验证分区,此函数作为支持文件包含在此示例中。要访问此函数,请以实时脚本形式打开此示例。留出 15% 的训练数据用于验证。
[idxTrain,idxValidation] = trainingPartitions(numObservations,[0.85 0.15]);

XValidation = XTrain(:,:,:,idxValidation);
anglesValidation = anglesTrain(idxValidation);

XTrain = XTrain(:,:,:,idxTrain);
anglesTrain = anglesTrain(idxTrain);
定义神经网络架构
定义神经网络架构。
对于图像输入,指定一个图像输入层。
指定四个 convolution-batchnorm-ReLU 模块,并增加滤波器数量。
在每个模块之间指定一个具有池化区域的平均池化层,步幅大小为 2。
对于回归,包含一个全连接层,其输出大小与响应数量匹配。
在此示例中,训练过程通过使用
NormalizeTargets训练选项(在 R2026a 中引入)自动对训练目标进行归一化。使用归一化目标有助于稳定训练,并使训练预测值与归一化目标高度匹配。若仅需神经网络在预测阶段输出未归一化值空间中的预测值,可添加反归一化层(在 R2026a 中引入)。在 R2026a 之前:为稳定训练,可在训练神经网络前手动对目标进行归一化。
numResponses = size(anglesTrain,2);

layers = [
    imageInputLayer([28 28 1])
    convolution2dLayer(3,8,Padding="same")
    batchNormalizationLayer
    reluLayer
    averagePooling2dLayer(2,Stride=2)
    convolution2dLayer(3,16,Padding="same")
    batchNormalizationLayer
    reluLayer
    averagePooling2dLayer(2,Stride=2)
    convolution2dLayer(3,32,Padding="same")
    batchNormalizationLayer
    reluLayer
    convolution2dLayer(3,32,Padding="same")
    batchNormalizationLayer
    reluLayer
    fullyConnectedLayer(numResponses)
    inverseNormalizationLayer];
指定训练选项
指定训练选项。在选项中进行选择需要经验分析。要通过运行试验探索不同训练选项配置,您可以使用Experiment Manager。
使用小批量大小 128 进行训练。
使用
NormalizeTargets参量(在 R2026a 中引入)自动对训练目标进行归一化。在 R2026a 之前:为稳定训练,可在训练神经网络前手动对目标进行归一化。采用初始学习率 0.001,并使用分段学习率调度,每 20 轮将学习率乘以因子 0.1 来降低学习率。
每轮利用验证数据对神经网络进行验证。
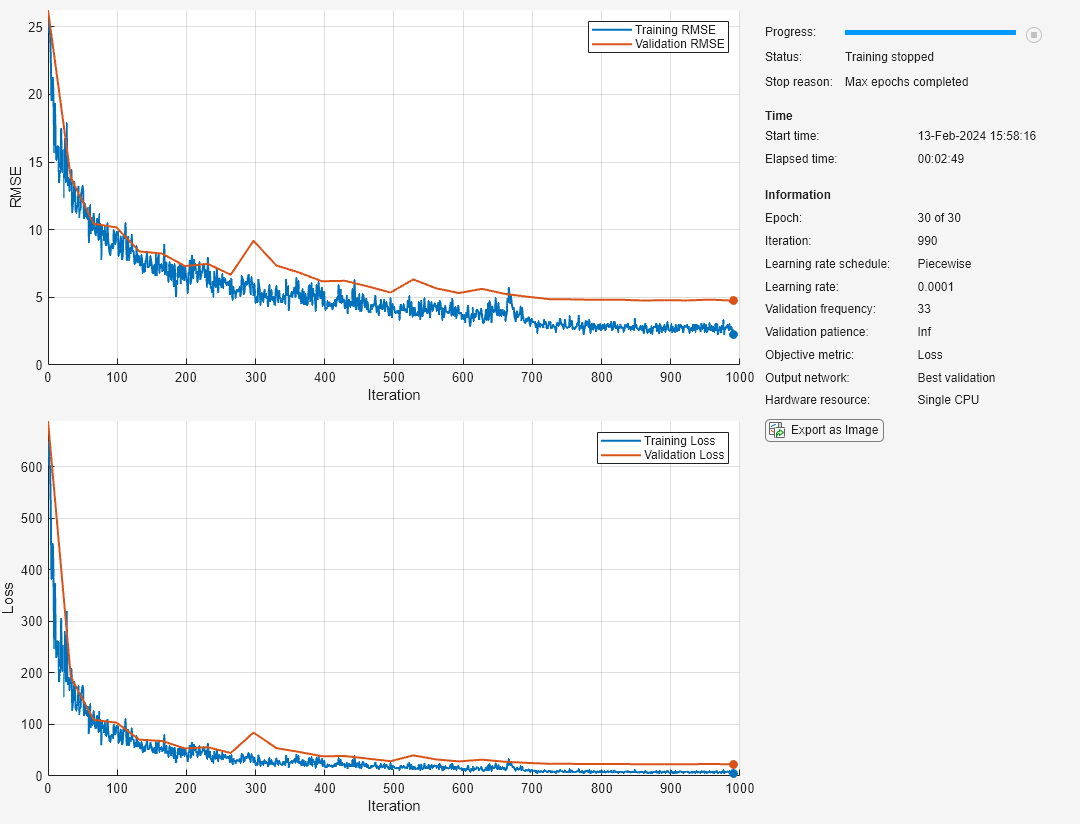
在绘图中显示训练进度。
禁用详尽输出。
miniBatchSize = 128;

schedule = piecewiseLearnRate( ...
    DropFactor=0.1, ...
    Period=20);

numIterationsPerEpoch = floor(numel(anglesTrain)/miniBatchSize);

options = trainingOptions("sgdm", ...
    NormalizeTargets=true, ...
    MiniBatchSize=miniBatchSize, ...
    InitialLearnRate=1e-3, ...
    LearnRateSchedule=schedule, ...
    Shuffle="every-epoch", ...
    ValidationData={XValidation,anglesValidation}, ...
    ValidationFrequency=numIterationsPerEpoch, ...
    Plots="training-progress", ...
    Verbose=false);
训练神经网络
使用 trainnet 函数训练神经网络。对于回归,请使用均方误差损失。默认情况下,trainnet 函数使用 GPU(如果有)。使用 GPU 需要 Parallel Computing Toolbox™ 许可证和受支持的 GPU 设备。有关受支持设备的信息,请参阅GPU 计算要求 (Parallel Computing Toolbox)。否则,该函数使用 CPU。要指定执行环境,请使用 ExecutionEnvironment 训练选项。
net = trainnet(XTrain,anglesTrain,layers,"mse",options);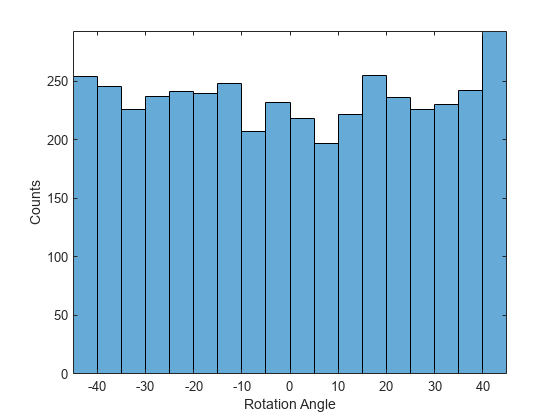
测试网络
使用 testnet 函数测试神经网络。对于回归,请计算均方根误差 (RMSE)。默认情况下,testnet 函数使用 GPU(如果有)。要手动选择执行环境,请使用 testnet 函数的 ExecutionEnvironment 参量。
rmse = testnet(net,XTest,anglesTest,"rmse")rmse = 7.6861
通过使用测试数据进行预测并将预测结果与目标进行比较,可视化绘图的准确度。使用 minibatchpredict 函数进行预测。默认情况下,minibatchpredict 函数使用 GPU(如果有)。
YTest = minibatchpredict(net,XTest);
绘制预测值对目标的图。
figure
scatter(YTest,anglesTest,"+")
xlabel("Prediction")
ylabel("Target")

hold on
plot([-60 60], [-60 60],"r--")
使用新数据进行预测
使用神经网络对第一个测试图像进行预测。要使用单个图像进行预测,请使用 predict 函数。要使用 GPU,请先将数据转换为 gpuArray。
X = XTest(:,:,:,1);
if canUseGPU
    X = gpuArray(X);
end
Y = predict(net,X)
Y = single

33.0647
figure
imshow(X)
title("Angle: " + gather(Y))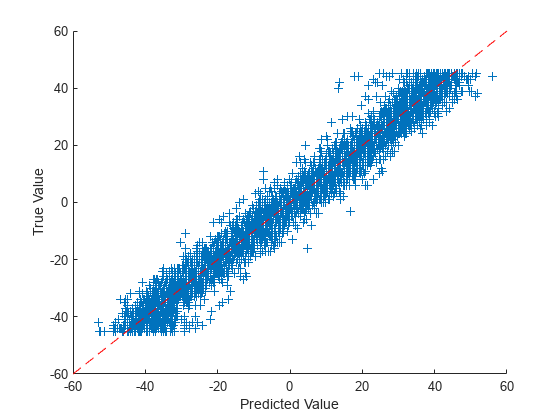
另请参阅
trainnet | trainingOptions | dlnetwork