plotLaneMarking
Display lane markings on bird’s-eye plot
Description
plotLaneMarking(
displays lane marking vertices, lmPlotter,lmv,lmf)lmv, and lane marking
faces, lmf, on a bird's-eye plot. The lane marking plotter,
lmPlotter, is associated with a birdsEyePlot object and
configures the display of the specified lane markings.
To remove all lane markings associated with the lane marking plotter
lmPlotter, call the clearData function and specify lmPlotter as
the input argument.
Examples
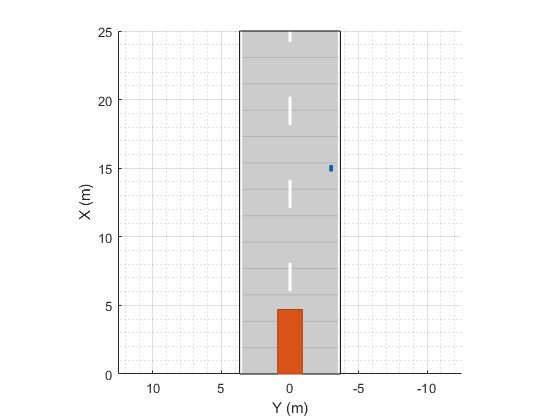
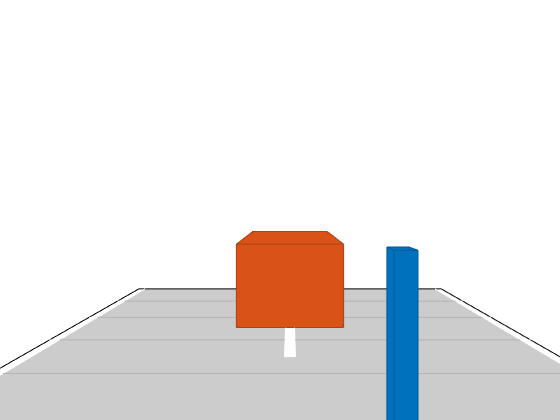
Create a driving scenario containing a car and pedestrian on a straight road. Then, create and display the lane markings of the road on a bird's-eye plot.
Create an empty driving scenario.
scenario = drivingScenario;
Create a straight, 25-meter road segment with two travel lanes in one direction.
lm = [laneMarking('Solid')
      laneMarking('Dashed','Length',2,'Space',4)
      laneMarking('Solid')];
l = lanespec(2,'Marking',lm);
road(scenario,[0 0 0; 25 0 0],'Lanes',l);
Add to the driving scenario a pedestrian crossing the road at 1 meter per second and a car following the road at 10 meters per second.
ped = actor(scenario,'ClassID',4,'Length',0.2,'Width',0.4,'Height',1.7);
car = vehicle(scenario,'ClassID',1);
smoothTrajectory(ped,[15 -3 0; 15 3 0],1);
smoothTrajectory(car,[car.RearOverhang 0 0; 25-car.Length+car.RearOverhang 0 0],10);
Display the scenario and corresponding chase plot.
plot(scenario)
chasePlot(car)

Run the simulation.
Create a bird's-eye plot.
Create an outline plotter, lane boundary plotter, and lane marking plotter for the bird's-eye plot.
Obtain the road boundaries and target outlines.
Obtain the lane marking vertices and faces.
Display the lane boundaries and lane markers.
Run the simulation loop.
bep = birdsEyePlot('XLim',[-25 25],'YLim',[-10 10]);
olPlotter = outlinePlotter(bep);
lbPlotter = laneBoundaryPlotter(bep);
lmPlotter = laneMarkingPlotter(bep,'DisplayName','Lanes');
legend('off');
while advance(scenario)
    rb = roadBoundaries(car);
    [position,yaw,length,width,originOffset,color] = targetOutlines(car);
    [lmv,lmf] = laneMarkingVertices(car);
    plotLaneBoundary(lbPlotter,rb);
    plotLaneMarking(lmPlotter,lmv,lmf);
    plotOutline(olPlotter,position,yaw,length,width, ...
        'OriginOffset',originOffset,'Color',color);
end


Input Arguments
Version History
Introduced in R2018a