rangeDetectionPlotter
Syntax
Description
rangeDetPlotter = rangeDetectionPlotter(bep)rangeDetectionPlotter object that configures the display of
object detections from an ultrasonic sensor on a bird's-eye plot. The
rangeDetectionPlotter object is stored in the
Plotters property of the input birdsEyePlot object, bep. To plot the object detections,
use the plotRangeDetection function.
rangeDetPlotter = rangeDetectionPlotter(bep,Name=Value)Name=Value arguments. For example,
rangeDetectionPlotter(bep,DisplayName="Range Detections") sets the
display name that appears in the bird's-eye-plot legend.
Examples
Use a simulated ultrasonic sensor to generate detections for multiple vehicles in a driving scenario.
Create Driving Scenario
Create a driving scenario containing a three-lane road using lane specifications.
scenario = drivingScenario;
roadCenters = [-120 30 0;-60 0 0;0 0 0; 60 0 0; 120 30 0];
lspc = lanespec(3);
road(scenario,roadCenters,Lanes=lspc);
Create an ego vehicle that travels in the center lane at a velocity of 30 m/s.
egovehicle = vehicle(scenario,ClassID=1);
egopath = [1.5 0 0; 60 0 0; 111 25 0];
egospeed = 30;
smoothTrajectory(egovehicle,egopath,egospeed);
Add a target vehicle that travels ahead of the ego vehicle at 30.5 m/s in the right lane, and changes lanes close to the ego vehicle.
ftargetcar = vehicle(scenario,ClassID=1);
ftargetpath = [8 2; 60 -3.2; 120 33];
ftargetspeed = 30.5;
smoothTrajectory(ftargetcar,ftargetpath,ftargetspeed);
Add a second target vehicle that travels in the left lane at 32m/s.
ltargetcar = vehicle(scenario,ClassID=1);
ltargetpath = [-5.0 3.5 0; 60 3.5 0; 111 28.5 0];
ltargetspeed = 32;
smoothTrajectory(ltargetcar,ltargetpath,ltargetspeed);
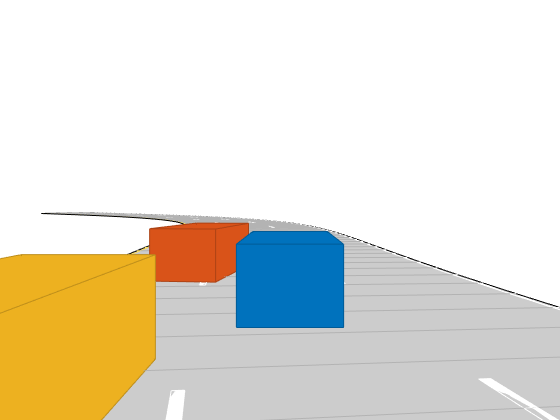
Display a chase plot from behind the ego vehicle for a 3D view of the scenario..
chasePlot(egovehicle)
Create Ultrasonic Sensors
Create an ultrasonic sensor mounted at the front of the ego vehicle.
frontUltrasonic = ultrasonicDetectionGenerator(1,FieldOfView=[70 35]);
frontUltrasonic.Profiles = actorProfiles(scenario);
Create a second ultrasonic sensor mounted on the left side of the ego vehicle.
leftUltrasonic = ultrasonicDetectionGenerator(2,MountingLocation=[0.5 1 0.2],MountingAngles=[90 0 0],FieldOfView=[70 35]);
leftUltrasonic.Profiles = actorProfiles(scenario);
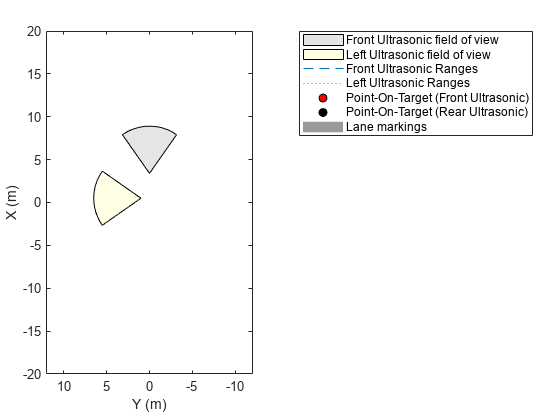
Create Bird's-Eye-Plot
Create a bird's-eye-plot for visualizing the sensor data. Add plotters for visualizing the ultrasonic coverage areas, detections, and points on targets. Use a rangeDetectionPlotter object to visualize ultrasonic detections as arcs and a detectionPlotter object to visualize the closest points on the target as markers. Add plotters to display the lane markings and vehicle outlines.
% Create bird's eye plot
bep = birdsEyePlot(XLim=[-20 20],YLim=[-12 12]);

% Plotters for Coverage areas of two ultrasonic sensors
fcaPlotter = coverageAreaPlotter(bep,DisplayName="Front Ultrasonic field of view");
plotCoverageArea(fcaPlotter,frontUltrasonic.MountingLocation(1:2), ...
  frontUltrasonic.DetectionRange(3),frontUltrasonic.MountingAngles(1),frontUltrasonic.FieldOfView(1));

lcaPlotter = coverageAreaPlotter(bep,DisplayName="Left Ultrasonic field of view",FaceColor="y");
plotCoverageArea(lcaPlotter,leftUltrasonic.MountingLocation(1:2), ...
  leftUltrasonic.DetectionRange(3),leftUltrasonic.MountingAngles(1),leftUltrasonic.FieldOfView(1));

% Range Detection Plotters for Ultrasonic Detections
frdPlotter = rangeDetectionPlotter(bep,DisplayName="Front Ultrasonic Ranges");
lrdPlotter = rangeDetectionPlotter(bep,DisplayName="Left Ultrasonic Ranges",LineStyle=":");

% Detection plotters for closest points on targets
fdetPlotter = detectionPlotter(bep,DisplayName="Point-On-Target (Front Ultrasonic)",MarkerFaceColor="r");
ldetPlotter = detectionPlotter(bep,DisplayName="Point-On-Target (Rear Ultrasonic)",MarkerFaceColor="k");

% Plotters for vehicle and target outlines, lane markings
olPlotter = outlinePlotter(bep);
lmPlotter = laneMarkingPlotter(bep,DisplayName="Lane markings");
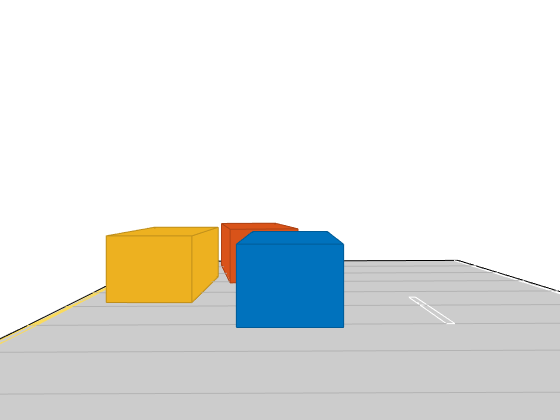
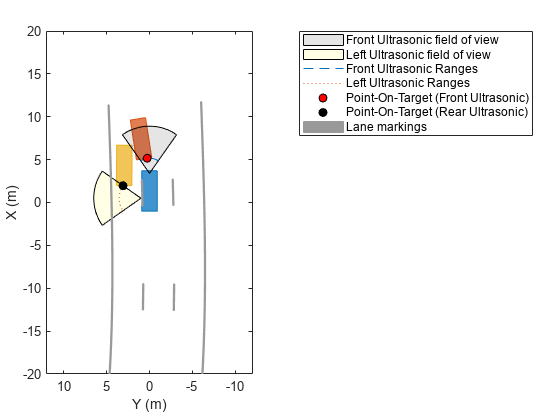
Run the Simulation and Generate Detections
Run the scenario simulation. At each timestep:
Obtain the ground truth target poses, and generate detections for the two ultrasonic sensors.
Obtain and display the target outlines and lane markings.
When there are valid detections, display the detections and the corresponding points-on-targets generated by the ultrasonic sensor.
while advance(scenario)

    tgtpose = targetPoses(egovehicle);

    [fobdets,fisValid] = frontUltrasonic(tgtpose,scenario.SimulationTime);
    [lobdets,lisValid] = leftUltrasonic(tgtpose,scenario.SimulationTime);

    [objposition,objyaw,objlength,objwidth,objoriginOffset,color] = targetOutlines(egovehicle);
    plotOutline(olPlotter,objposition,objyaw,objlength,objwidth, ...
        OriginOffset=objoriginOffset,Color=color)

    [lmv,lmf] = laneMarkingVertices(egovehicle);
    plotLaneMarking(lmPlotter,lmv,lmf)

    if ~isempty(fobdets) && fisValid
        franges = fobdets{1}.Measurement;
        plotRangeDetection(frdPlotter,franges,frontUltrasonic.FieldOfView(1),frontUltrasonic.MountingLocation,frontUltrasonic.MountingAngles)
        plotDetection(fdetPlotter,fobdets{1}.ObjectAttributes{1}.PointOnTarget(1:2)')
    end

    if ~isempty(lobdets) && lisValid
        lranges = lobdets{1}.Measurement;
        plotRangeDetection(lrdPlotter,lranges,leftUltrasonic.FieldOfView(1),leftUltrasonic.MountingLocation,leftUltrasonic.MountingAngles)
        plotDetection(ldetPlotter,lobdets{1}.ObjectAttributes{1}.PointOnTarget(1:2)')
    end
end
Input Arguments
Name-Value Arguments
Specify optional pairs of arguments as
Name1=Value1,...,NameN=ValueN, where Name is
the argument name and Value is the corresponding value.
Name-value arguments must appear after other arguments, but the order of the
pairs does not matter.
Before R2021a, use commas to separate each name and value, and enclose
Name in quotes.
Example: LineWidth=1
Plotter name to display in the legend, specified as a character vector or string scalar. If you do not specify a name, the bird's-eye plot does not display a legend entry for the plotter.
Range line style, specified as one of the options listed in this table.
| Line Style | Description | Resulting Line |
|---|---|---|
"-" | Solid line |
|
"--" | Dashed line |
|
":" | Dotted line |
|
"-." | Dash-dotted line |
|
"none" | No line | No line |
Width of range line, specified as a positive scalar.
Font size for range labels, specified as a positive integer in font points.
Gap between label and positional point, specified as a real-valued vector of the form [x y]. Units are in meters.
Tag associated with the plotter object, specified a character vector or string
scalar. The default value is 'Plotter,
where N'N is an integer that corresponds to the
Nth plotter associated with the input birdsEyePlot object.
Output Arguments
Version History
Introduced in R2022a
See Also
plotRangeDetection | ultrasonicDetectionGenerator | birdsEyePlot | clearData