chasePlot
Ego-centric projective perspective plot
Description
chasePlot( plots a driving scenario
from the perspective of actor ac)ac. This plot is called a
chase plot and has an ego-centric projective perspective,
where the view is positioned immediately behind the actor.
chasePlot(
specifies options using one or more name-value pairs. For example, you can display
road centers and actor waypoints on the plot.ac,Name,Value)
Examples
Simulate a driving scenario with one car traveling on an S-curve. Create and plot the lane boundaries.
Create the driving scenario with one road having an S-curve.
scenario = drivingScenario('StopTime',3);
roadcenters = [-35 20 0; -20 -20 0; 0 0 0; 20 20 0; 35 -20 0];
Create the lanes and add them to the road.
lm = [laneMarking('Solid','Color','w'); ...
    laneMarking('Dashed','Color','y'); ...
    laneMarking('Dashed','Color','y'); ...
    laneMarking('Solid','Color','w')];
ls = lanespec(3,'Marking',lm);
road(scenario,roadcenters,'Lanes',ls);
Add an ego vehicle and specify its trajectory from its waypoints. By default, the car travels at a speed of 30 meters per second.
car = vehicle(scenario, ...
    'ClassID',1, ...
    'Position',[-35 20 0]);
waypoints = [-35 20 0; -20 -20 0; 0 0 0; 20 20 0; 35 -20 0];
smoothTrajectory(car,waypoints);
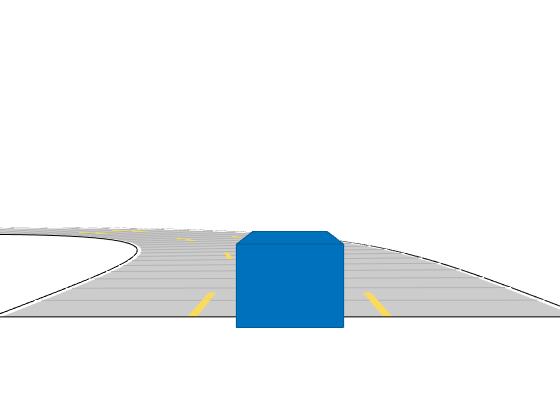
Plot the scenario and corresponding chase plot.
plot(scenario)
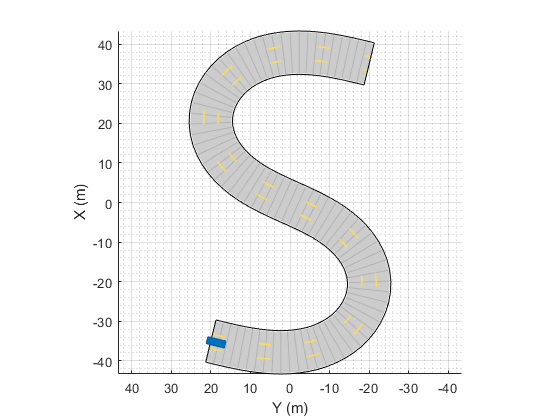
chasePlot(car)
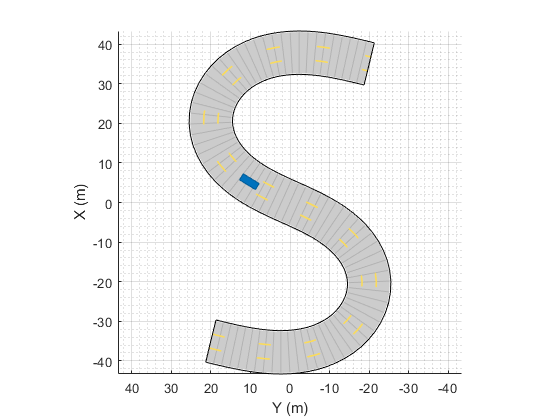
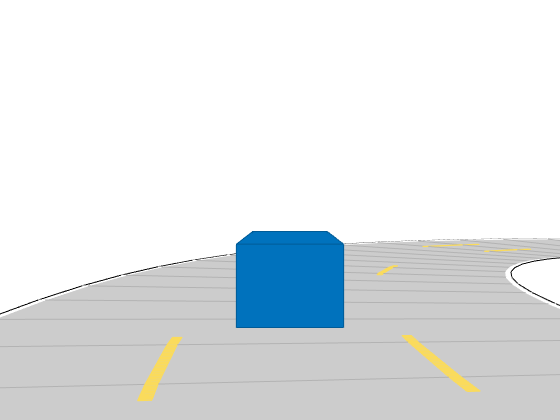
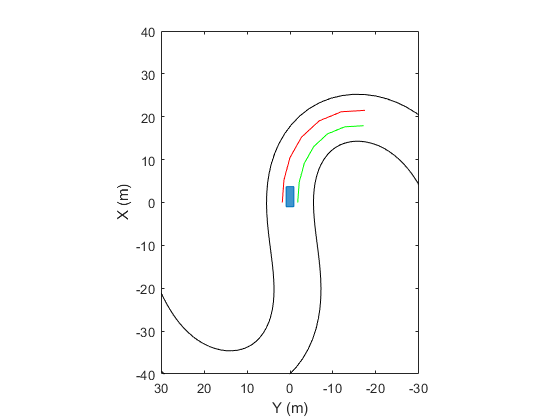
Run the simulation loop.
Initialize a bird's-eye plot and create an outline plotter, left-lane and right-lane boundary plotters, and a road boundary plotter.
Obtain the road boundaries and rectangular outlines.
Obtain the lane boundaries to the left and right of the vehicle.
Advance the simulation and update the plotters.
bep = birdsEyePlot('XLim',[-40 40],'YLim',[-30 30]);
olPlotter = outlinePlotter(bep);
lblPlotter = laneBoundaryPlotter(bep,'Color','r','LineStyle','-');
lbrPlotter = laneBoundaryPlotter(bep,'Color','g','LineStyle','-');
rbsEdgePlotter = laneBoundaryPlotter(bep);
legend('off');
while advance(scenario)
    rbs = roadBoundaries(car);
    [position,yaw,length,width,originOffset,color] = targetOutlines(car);
    lb = laneBoundaries(car,'XDistance',0:5:30,'LocationType','Center', ...
        'AllBoundaries',false);
    plotLaneBoundary(rbsEdgePlotter,rbs)
    plotLaneBoundary(lblPlotter,{lb(1).Coordinates})
    plotLaneBoundary(lbrPlotter,{lb(2).Coordinates})
    plotOutline(olPlotter,position,yaw,length,width, ...
        'OriginOffset',originOffset,'Color',color)
end
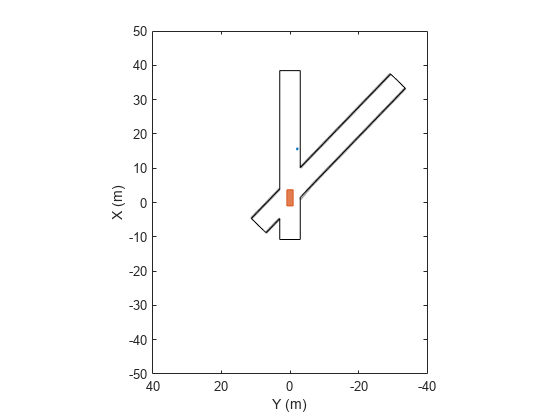
Create a driving scenario and show how target outlines change as the simulation advances.
Create a driving scenario consisting of two intersecting straight roads. The first road segment is 45 meters long. The second straight road is 32 meters long with jersey barriers along both its edges, and intersects the first road. A car traveling at 12.0 meters per second along the first road approaches a running pedestrian crossing the intersection at 2.0 meters per second.
scenario = drivingScenario('SampleTime',0.1,'StopTime',1);
road1 = road(scenario,[-10 0 0; 45 -20 0]);
road2 = road(scenario,[-10 -10 0; 35 10 0]);
barrier(scenario,road1)
barrier(scenario,road1,'RoadEdge','left')
ped = actor(scenario,'ClassID',4,'Length',0.4,'Width',0.6,'Height',1.7);
car = vehicle(scenario,'ClassID',1);
pedspeed = 2.0;
carspeed = 12.0;
smoothTrajectory(ped,[15 -3 0; 15 3 0],pedspeed);
smoothTrajectory(car,[-10 -10 0; 35 10 0],carspeed);
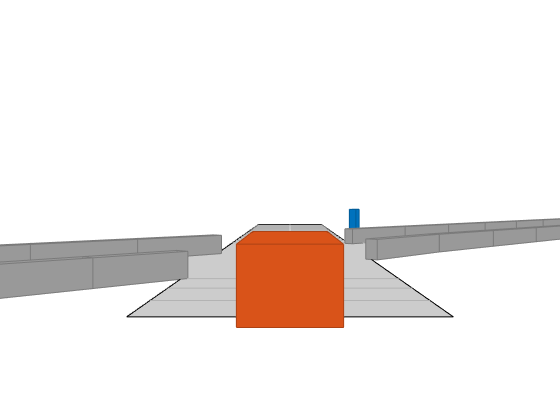
Create an ego-centric chase plot for the vehicle.
chasePlot(car,'Centerline','on')
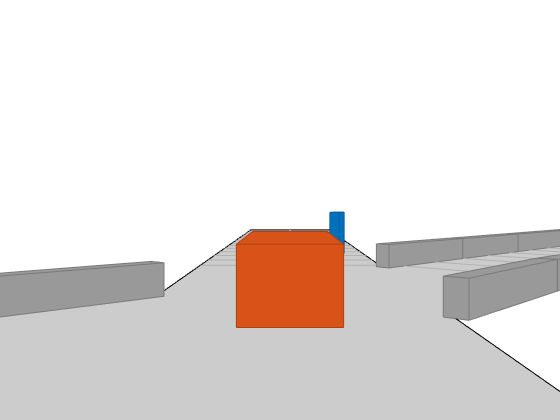
Create an empty bird's-eye plot and add an outline plotter and lane boundary plotter. Then, run the simulation. At each simulation step:
Update the chase plot to display the road boundaries and target outlines.
Update the bird's-eye plot to display the updated road boundaries and target outlines. The plot perspective is always with respect to the ego vehicle.
bepPlot = birdsEyePlot('XLim',[-50 50],'YLim',[-40 40]);
outlineplotter = outlinePlotter(bepPlot);
laneplotter = laneBoundaryPlotter(bepPlot);
legend('off')

while advance(scenario)
    rb = roadBoundaries(car);
    [position,yaw,length,width,originOffset,color] = targetOutlines(car);
    [bposition,byaw,blength,bwidth,boriginOffset,bcolor,barrierSegments] = targetOutlines(car,'Barriers');
    plotLaneBoundary(laneplotter,rb)
    plotOutline(outlineplotter,position,yaw,length,width, ...
        'OriginOffset',originOffset,'Color',color)
    plotBarrierOutline(outlineplotter,barrierSegments,bposition,byaw,blength,bwidth, ...
        'OriginOffset',boriginOffset,'Color',bcolor)
    pause(0.01)
end
Input Arguments
Name-Value Arguments
Version History
Introduced in R2017a