plotBarrierOutline
Display barrier outlines on bird's-eye plot
Syntax
Description
plotBarrierOutline(
displays the rectangular outlines of barriers on a bird's-eye plot. Specify the barrier, as
well as the position, yaw angle of rotation, length, and width of each barrier segment. The
outline plotter olPlotter,barrierSegments,positions,yaw,length,width)olPlotter, is associated with a birdsEyePlot object, and configures the display of the specified
outlines.
To remove all outlines associated with the outline plotter
olPlotter, use the clearData
function and specify olPlotter as the input argument.
To display the outlines of the barriers that are in a driving scenario, first use
targetOutlines
with the 'Barriers' flag as input, to get the dimensions of the barriers.
Then, use the plotBarrierOutline function to display the outlines of
all the barriers in a bird's-eye plot.
plotBarrierOutline(___,
specifies options using one or more Name,Value)Name,Value pair arguments and the
input arguments from the previous syntax.
Examples
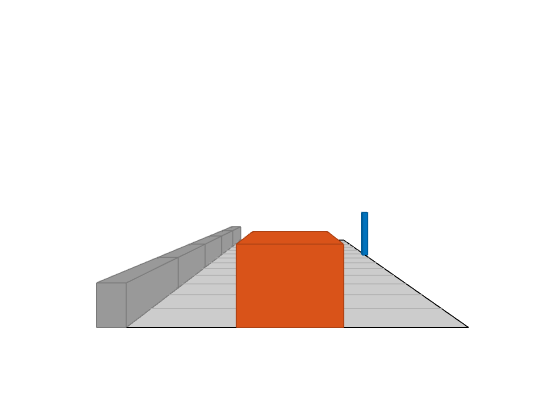
Create a driving scenario. Create a 25 m road segment with a barrier on its left edge. Add a pedestrian that crosses the road at 1 m/s, and a vehicle that drives along the road at 10 m/s.
scenario = drivingScenario;

r = road(scenario,[0 0 0; 25 0 0]);
barrier(scenario,r,'RoadEdge','left')

p = actor(scenario,'ClassID',4,'Length',0.2,'Width',0.4,'Height',1.7);
v = vehicle(scenario,'ClassID',1);

smoothTrajectory(p,[15 -3 0; 15 3 0],1)
smoothTrajectory(v,[v.RearOverhang 0 0; 25-v.Length+v.RearOverhang 0 0],10)
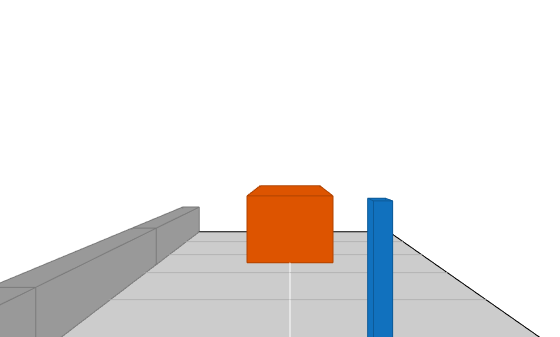
Use a chase plot to display the scenario from the perspective of the vehicle.
chasePlot(v,'Centerline','on')
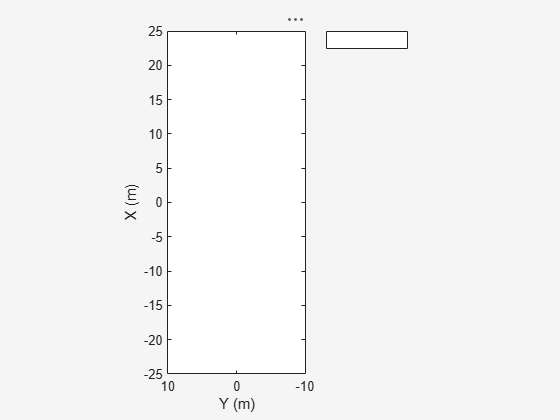
Create a bird's-eye plot, outline plotter, and lane boundary plotter.
bep = birdsEyePlot('XLim',[-25 25],'YLim',[-10 10]);
olPlotter = outlinePlotter(bep);
lbPlotter = laneBoundaryPlotter(bep);
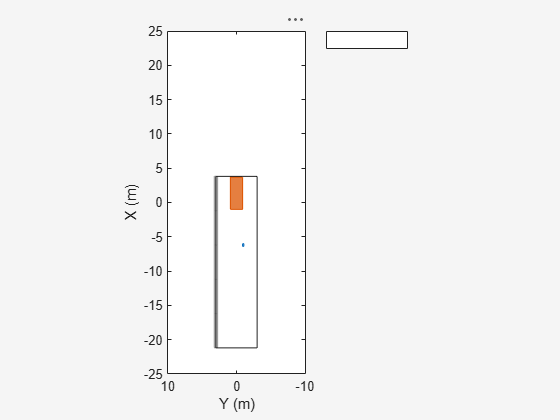
legend('off')Run the simulation loop. Update the plotter with outlines for the targets.
while advance(scenario)
   % Obtain the road boundaries and rectangular outlines.
   rb = roadBoundaries(v);
   [position,yaw,length,width,originOffset,color] = targetOutlines(v);
   [bposition,byaw,blength,bwidth,boriginOffset,bcolor,numBarrierSegments] = targetOutlines(v,'Barriers');

   % Update the bird's-eye plotters with the road, actors and barriers.
   plotLaneBoundary(lbPlotter,rb);
   plotOutline(olPlotter,position,yaw,length,width, ...
               'OriginOffset',originOffset,'Color',color);
   plotBarrierOutline(olPlotter,numBarrierSegments,bposition,byaw,blength,bwidth, ...
               'OriginOffset',boriginOffset,'Color',bcolor);
   % Allow time for plot to update.
   pause(0.01)
end
Input Arguments
Name-Value Arguments
Version History
Introduced in R2021a