Main Content

designNotchPeakIIR

Design and implement high-order Butterworth notch or peak IIR filter

Since R2023b

Description

[B,A] = designNotchPeakIIR designs a peak IIR filter with the filter order of 2, the center frequency of 0.5 rad/s, and the quality factor of 2.5.

B and A contain the second-order section coefficients for the numerator and denominator of the peak IIR filter, respectively. The arrays B and A have a size of N-by-3, where N is the number of filter sections and equals half the filter order.

The System object™ argument is false by default. To implement the filter, assign the filter coefficients to a dsp.SOSFilter object.

example

[B,A] = designNotchPeakIIR(Name=Value) specifies options using one or more name-value arguments.

For example, [B,A] = designNotchPeakIIR(Response="notch",FilterOrder=10,CenterFrequency=0.55,Bandwidth=0.3) designs a notch IIR filter with the filter order of 10, the center frequency of 0.55 rad/s, and the 3-dB bandwidth of 0.3.

When you specify only a partial list of filter parameters, the function designs the filter by setting the other design parameters to their default values.

This function supports code generation under certain conditions. For more information, see Code Generation.

[B,A,SV] = designNotchPeakIIR(Name=Value) also returns scale values when you specify the HasScaleValues argument. SV is a vector of 1s when you set the argument to false and a vector of scale values when you set it to true.

example

filtObj = designNotchPeakIIR(Name=Value) designs a notch or peak IIR filter and implements a dsp.SOSFilter object.

This syntax applies when you set the SystemObject argument to true.

Examples

collapse all

Design a peak filter of order 14 and a center frequency at 0.2 rad/s using the designNotchPeakIIR function. Output scale values by setting the HasScaleValues property to true.

[b,a,sv] = designNotchPeakIIR(FilterOrder=14, CenterFrequency=0.2,...
    HasScaleValues=true)
b = 7×3

    1.0000    2.0000    1.0000
    1.0000   -2.0000    1.0000
    1.0000    2.0000    1.0000
    1.0000   -2.0000    1.0000
    1.0000    2.0000    1.0000
    1.0000   -2.0000    1.0000
    1.0000         0   -1.0000

a = 7×3

    1.0000   -1.4026    0.9374
    1.0000   -1.7004    0.9549
    1.0000   -1.3637    0.8373
    1.0000   -1.6111    0.8736
    1.0000   -1.3788    0.7823
    1.0000   -1.5195    0.8103
    1.0000   -1.4366    0.7757

sv = 8×1

    0.1220
    0.1220
    0.1166
    0.1166
    0.1133
    0.1133
    0.1122
    1.0000

Assign the filter design coefficients to a dsp.SOSFilter object.

peakFilter = dsp.SOSFilter(b,a,ScaleValues=sv)
peakFilter = 
  dsp.SOSFilter with properties:

            Structure: 'Direct form II transposed'
    CoefficientSource: 'Property'
            Numerator: [7x3 double]
          Denominator: [7x3 double]
       HasScaleValues: true
          ScaleValues: [8x1 double]

  Use get to show all properties

Create a dsp.DynamicFilterVisualizer object to display the magnitude response of the filter.

dfv = dsp.DynamicFilterVisualizer(NormalizedFrequency=true);
dfv(peakFilter)

Create a spectrumAnalyzer object to visualize the input and output spectra.

scope = spectrumAnalyzer(SampleRate=2,PlotAsTwoSidedSpectrum=false,...
    ChannelNames=["Input Signal","Filtered Signal"]);

Stream in random data and filter the signal using the peak filter you have designed.

for i = 1:1000
    x = randn(1024, 1);
    y = peakFilter(x);
    scope(x,y);
end
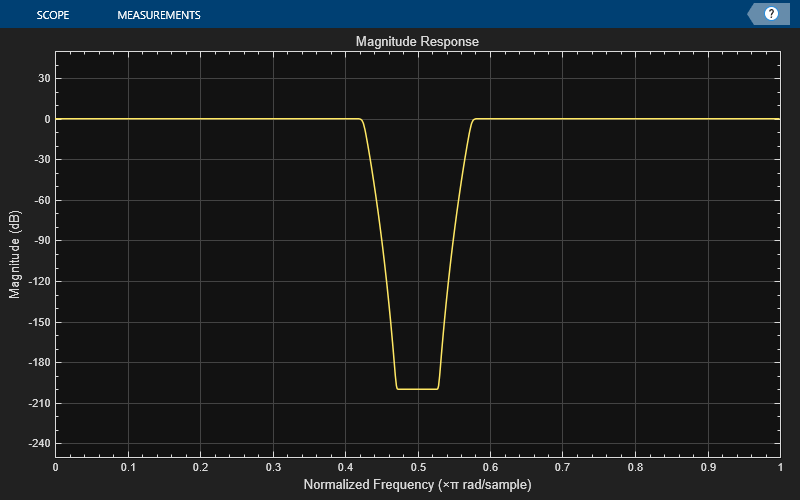
Design a notch filter object of order 48 and a bandwidth of 0.15 using the designNotchPeakIIR function.

notchFilter = designNotchPeakIIR(FilterOrder=48,Bandwidth=0.15,...
    Response='notch',SystemObject=true)
notchFilter = 
  dsp.SOSFilter with properties:

            Structure: 'Direct form II transposed'
    CoefficientSource: 'Property'
            Numerator: [24x3 double]
          Denominator: [24x3 double]
       HasScaleValues: false

  Use get to show all properties

Create a dsp.DynamicFilterVisualizer object to display the magnitude response of the filter.

dfv = dsp.DynamicFilterVisualizer(NormalizedFrequency=true,YLimits=[-250 50]);
dfv(notchFilter)

Create a spectrumAnalyzer object to visualize the input and output spectra.

scope = spectrumAnalyzer(SampleRate=2,PlotAsTwoSidedSpectrum=false,...
    ChannelNames=["Input Signal","Filtered Signal"]);

Stream in random data and filter the signal using the notch filter.

for i = 1:1000
    x = randn(1024, 1);
    y = notchFilter(x);
    scope(x,y);
end

Input Arguments

collapse all

Name-Value Arguments

Specify optional pairs of arguments as Name1=Value1,...,NameN=ValueN, where Name is the argument name and Value is the corresponding value. Name-value arguments must appear after other arguments, but the order of the pairs does not matter.

Example: designNotchPeakIIR(FilterOrder=14,CenterFrequency=0.2,HasScaleValues=true)

Filter response, specified as "peak" or "notch".

Data Types: char | string

Order of the notch or peak IIR filter, N, specified as an even nonnegative integer.

Data Types: single | double | int8 | int16 | int32 | int64 | uint8 | uint16 | uint32 | uint64

Center frequency of the notch or peak IIR filter, ω0, in rad/s, specified as a normalized scalar in the range:

Data Types: single | double

Quality factor (or Q factor) of the notch or peak IIR filter, Q, specified as a positive scalar. The Q factor is defined as the center frequency ω0 divided by the bandwidth bw, that is, Q=ω0/bw. A higher Q factor corresponds to a narrower notch or peak.

Data Types: single | double | int8 | int16 | int32 | int64 | uint8 | uint16 | uint32 | uint64

3-dB bandwidth of the notch or peak IIR filter, bw, specified as a normalized scalar in the range [0,1].

Data Types: single | double

Option to compute scale values for each section, specified as true or false. When you set this property to true, the function returns scale values that you can apply before and after each section of the second-order section filter.

Data Types: logical

Option to create System object, specified as:

  • false –– The function returns second-order section coefficient matrices.

  • true –– The function returns a dsp.SOSFilter object.

Data Types: logical

Option to print the entire function call in MATLAB, specified as one of these:

  • false –– The function does not print the function call.

  • true –– The function prints the entire function call including the default values of the Name=Value arguments that you did not specify when calling the function.

    Use this argument to view all the values used by the function to design and implement the filter.

Data Types: logical

Output Arguments

collapse all

Numerator coefficients of notch or peak IIR filter, returned as an N/2-by-3 array, where N/2 is the number of filter sections and N is the filter order.

Data Types: double

Denominator coefficients of notch or peak IIR filter, returned as an N/2-by-3 array, where N/2 is the number of filter sections and N is the filter order.

The leading denominator coefficient is always 1.

Data Types: double

Scale values between sections returned as a column vector of length N/2+1, where N/2 is the number of filter sections and N is the filter order.

If you set HasScaleValues to true, then SV is a column vector of 1s.

Data Types: double

Filter object, returned as a dsp.SOSFilter object. The designNotchPeakIIR function updates the HasScaleValues and the ScaleValues arguments in the dsp.SOSFilter object depending on whether you set the HasScaleValues argument to true or false when calling the function.

References

[1] Orfanidis , SJ. High-Order Digital Parametric Equalizer Design. 2005, pp. 1026–46.

Extended Capabilities

Version History

Introduced in R2023b