visualize
Visualize filter stages
Syntax
Description
Examples
Filter an input signal through a complex bandpass decimator and visualize the filtered spectrum in a spectrum analyzer.
Initialization
Create a dsp.ComplexBandpassDecimator System object™ with center frequency set to 2000 Hz, bandwidth of interest set to 1000 Hz, and sample rate set to 48 kHz. The decimation factor is computed as the ratio of the sample rate to the bandwidth of interest. The input to the decimator is a sine wave with a frame length of 1200 samples with tones at 1625 Hz, 2000 Hz, and 2125 Hz. Create a spectrumAnalyzer scope to visualize the signal spectrum.
Fs = 48e3;
CF = 2000;
BW = 1000;
D  =  Fs/BW;
FrameLength = 1200;
bpdecim = dsp.ComplexBandpassDecimator(D,CF,Fs);

sa = spectrumAnalyzer(SampleRate=Fs/D,...
    Method="welch",...
    YLimits=[-120 40],...
    FrequencyOffset=CF);

tones = [1625 2000 2125];
sin = dsp.SineWave(SampleRate=Fs,Frequency=tones,...
    SamplesPerFrame=FrameLength);
Visualize Filter Stages
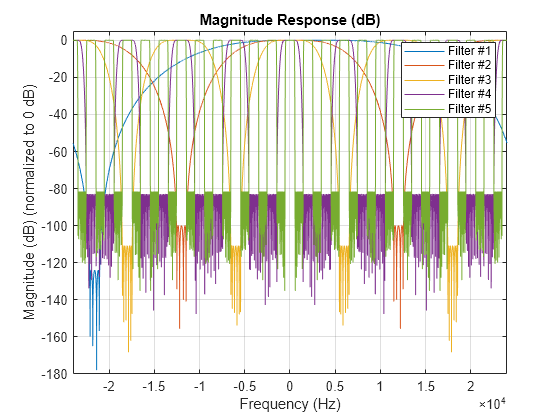
Using the visualize function, you can visualize the response of each individual filter stage.
visualize(bpdecim)

Display Filter info
The info function displays information about the bandpass decimator.
fprintf("%s",info(bpdecim))Overall Decimation Factor : 48 Bandwidth : 1000 Hz Number of Filters : 5 Real multiplications per Input Sample: 14.708333 Real additions per Input Sample : 13.833333 Number of Coefficients : 89 Filters: Filter 1: dsp.FIRDecimator - Decimation Factor : 2 Filter 2: dsp.FIRDecimator - Decimation Factor : 2 Filter 3: dsp.FIRDecimator - Decimation Factor : 2 Filter 4: dsp.FIRDecimator - Decimation Factor : 3 Filter 5: dsp.FIRDecimator - Decimation Factor : 2
Stream In and Filter Signal
Construct a for-loop to run for 1000 iterations. In each iteration, stream in 1200 samples (one frame) of the noisy sine wave and apply the complex bandpass decimator on each frame of the input signal. Visualize the input and output spectrum in the spectrum analyzer, sa.
for index = 1:1000
    x = sum(sin(),2) +  1e-4*randn(FrameLength,1);
    z = bpdecim(x);
    sa(z);
end
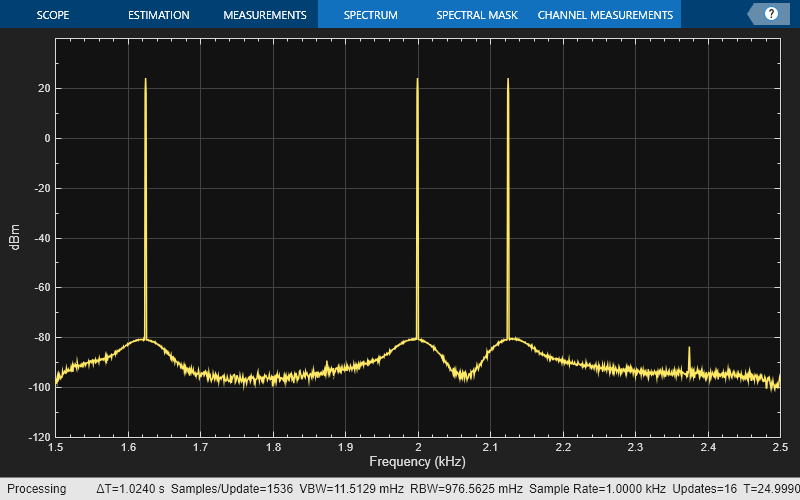
The bandpass decimator with center frequency at 2000 Hz and a bandwidth of 1000 Hz passes the three sine wave tones at 1625 Hz, 2000 Hz, and 2125 Hz.
Change the center frequency of the decimator to 2400 Hz and filter the signal.
release(bpdecim);
bpdecim.CenterFrequency = 2400
bpdecim =
  dsp.ComplexBandpassDecimator with properties:

                CenterFrequency: 2400
                  Specification: 'Decimation factor'
               DecimationFactor: 48
            StopbandAttenuation: 80
                TransitionWidth: 100
    MinimizeComplexCoefficients: true
            NormalizedFrequency: false
                     SampleRate: 48000
Configure the spectrum analyzer to show the bandwidth of interest, [-1900, 2900] Hz.
release(sa)
sa.FrequencyOffset = 2400;
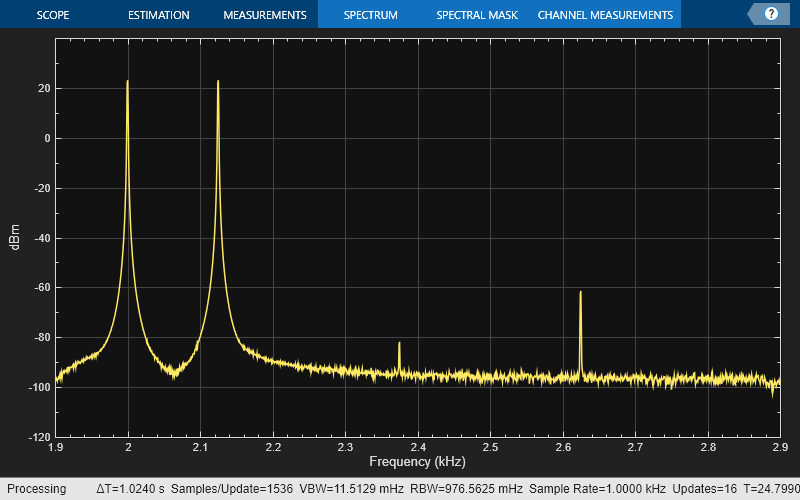
Stream in the data and filter the signal.
for index = 1:1000
    x = sum(sin(),2) +  1e-4 * randn(FrameLength,1);
    z = bpdecim(x);
    sa(z);
end
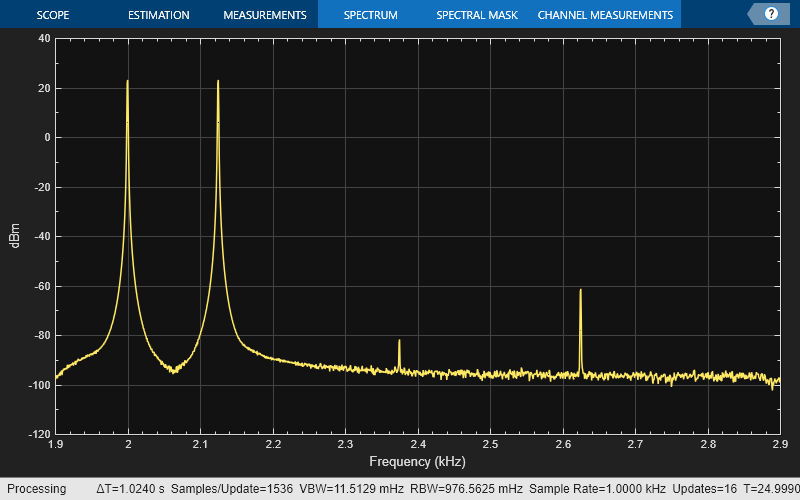
The tones at 2000 Hz and 2125 Hz are passed through the decimator, while the tone at 1625 Hz is filtered out.
Create a multistage sample rate converter with default properties, corresponding to the combined three filter stages used to convert from 192 kHz to 44.1 kHz. Visualize the stages.
src = dsp.SampleRateConverter;
visualize(src)
