Main Content

SpectralMaskConfiguration

Display upper and lower spectral mask lines in the spectrum analyzer

Since R2022a

    Description

    Use the SpectralMaskConfiguration object to overlay a spectral mask on a spectrum in the spectrum analyzer. If the mask is green, the signal is within the mask limits. If the mask is red, the signal fails the mask limits.

    You can check the status of the spectral mask from the scope toolbar, the command line, or event listeners.

    • To modify a spectral mask and see its status, in the scope toolbar, click the spectral mask button . You can modify the masks in the Spectral Mask tab on the spectrum analyzer toolstrip. Use the getSpectralMaskStatus function to obtain mask details, such as number of times a mask succeeded, number of times a mask failed, channels causing mask failure, and so on.

    • Use the MaskTestFailed event to perform an action every time the mask fails. To trigger a function when the mask fails, create a listener to the MaskTestFailed event and define a callback function to trigger. For more details about using events, see Events.

    Both the spectrumAnalyzer object and the SpectrumAnalyzerBlockConfiguration object support the SpectralMaskConfiguration object in the command line.
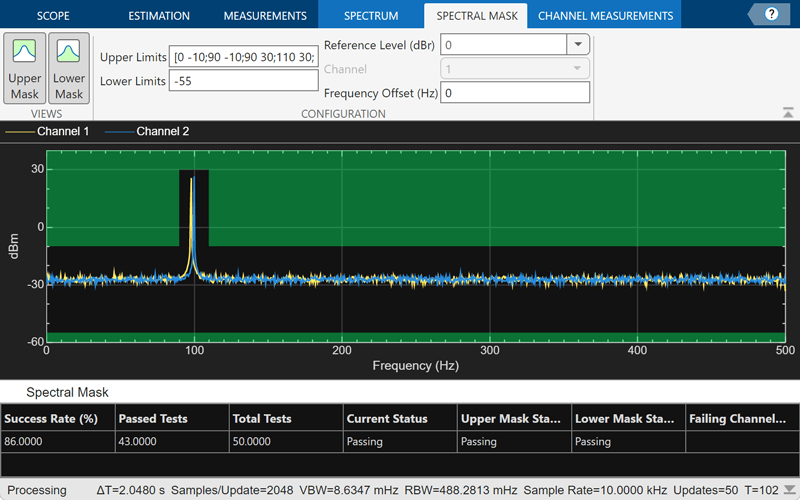
    Snapshot showing spectral mask.

    Creation

    Description

    mask = SpectralMaskConfiguration() creates a spectral mask object.

    example

    Properties

    expand all

    All properties are tunable.

    Spectral mask to enable, specified as "none", "lower", "upper", or "upper-and-lower".

    Scope Window Use

    Click the Spectral Mask tab on the spectrum analyzer toolstrip. In the Views section, select Upper Mask, Lower Mask, or both.

    The Spectral Mask tab appears when you:

    • Select Spectrum in the Scope tab.

    • In the drop-down list under Spectrum, choose either Power or Power Density.

    Data Types: char | string

    Limit for the upper spectral mask, specified as a scalar or two-column matrix.

    If UpperMask is a scalar, the upper limit mask uses the same power value for all frequencies specified in the spectrum analyzer.

    If UpperMask is a matrix, the first column contains the frequency values (Hz), which correspond to the x-axis values. The second column contains the power values, which correspond to the associated y-axis values.

    To apply offsets to the power and frequency values, use the ReferenceLevel and MaskFrequencyOffset properties.

    Scope Window Use

    Click the Spectral Mask tab on the spectrum analyzer toolstrip. In the Configuration section, specify Upper Limits.

    The Spectral Mask tab appears when you:

    • Select Spectrum in the Scope tab.

    • In the drop-down list under Spectrum, choose Power or Power Density.

    Data Types: double

    Limit for the lower spectral mask, specified as a scalar or two-column matrix.

    If LowerMask is a scalar, the lower limit mask uses the same power value for all frequencies specified in the spectrum analyzer.

    If LowerMask is a matrix, the first column contains the frequency values (Hz), which correspond to the x-axis values. The second column contains the power values, which correspond to the associated y-axis values.

    To apply offsets to the power and frequency values, use the ReferenceLevel and MaskFrequencyOffset property values.

    Scope Window Use

    Click the Spectral Mask tab on the spectrum analyzer toolstrip. In the Configuration section, specify Lower Limits.

    The Spectral Mask tab appears when you:

    • Select Spectrum in the Scope tab.

    • In the drop-down list under Spectrum, choose Power or Power Density.

    Data Types: double

    Reference level for mask power values, specified as either "custom" or "spectrum-peak".

    When you specify ReferenceLevel as "custom", the object uses the value you specify in the CustomReferenceLevel property as the reference to the power values (in dBr) in the UpperMask and LowerMask properties.

    When you specify ReferenceLevel as "spectrum-peak", the object uses the peak value of the current spectrum of the SelectedChannel as the reference power value.

    Scope Window Use

    Click the Spectral Mask tab on the spectrum analyzer toolstrip. In the Configuration section, set Reference Level (dBr) to either Spectrum peak or enter a real scalar.

    The Spectral Mask tab appears when you:

    • Select Spectrum in the Scope tab.

    • In the drop-down list under Spectrum, choose Power or Power Density.

    Data Types: char | string

    Custom reference level to the power values, specified as a real numeric scalar. The reference level should have the same units as the SpectrumUnits property of the spectrum analyzer. The reference level is the value to which the object references the power values in the UpperMask and LowerMask properties.

    Dependency

    To enable this property, set ReferenceLevel to "custom". This property uses the same units as the SpectrumUnits property of the spectrum analyzer.

    Scope Window Use

    Click the Spectral Mask tab on the spectrum analyzer toolstrip. In the Configuration section, set Reference Level (dBr) to either Spectrum peak or enter a real scalar.

    The Spectral Mask tab appears when you:

    • Select Spectrum in the Scope tab.

    • In the drop-down list under Spectrum, choose Power or Power Density.

    Data Types: double

    Input channel with peak spectrum to use as the mask reference level, specified as an integer.

    Dependency

    To enable this property, set ReferenceLevel to "spectrum-peak".

    Scope Window Use

    Click the Spectral Mask tab on the spectrum analyzer toolstrip. In the Configuration section, specify Channel as an integer.

    To enable Channel, set Reference Level (dBr) in the Configuration section to Spectrum peak and display some data on the scope.

    The Spectral Mask tab appears when you:

    • Select Spectrum in the Scope tab.

    • In the drop-down list under Spectrum, choose Power or Power Density.

    Frequency offset, specified as a finite numeric scalar. The object offsets the frequency values in the UpperMask and LowerMask properties by this value.

    Scope Window Use

    Click the Spectral Mask tab on the spectrum analyzer toolstrip. In the Configuration section, set Frequency Offset (Hz) to a real scalar.

    The Spectral Mask tab appears when you:

    • Select Spectrum in the Scope tab.

    • In the drop-down list under Spectrum, choose Power or Power Density.

    Data Types: double

    Object Functions

    getSpectralMaskStatusGet test results of current spectral mask

    Examples

    collapse all

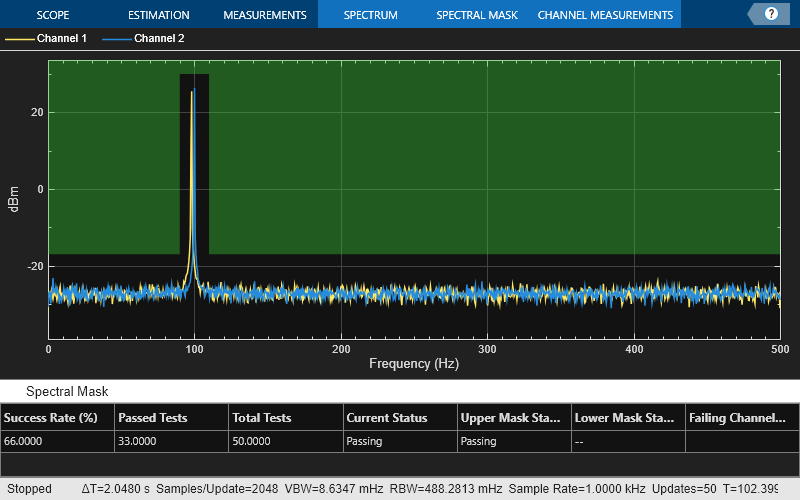
    Create an upper spectral mask, set the reference level matrix, and add it to a Spectrum Analyzer object.

    mask = SpectralMaskConfiguration();
    mask.EnabledMasks = "upper";
    mask.UpperMask = [...
          0 -17; ...
         90 -17; ...
         90  30; ...
        110  30; ...
        110 -17; ...
        500 -17];
    
    scope = spectrumAnalyzer(PlotAsTwoSidedSpectrum=false,...
        ShowLegend=true);
    scope.SpectralMask = mask;
    scope.SpectralMask
    ans = 
      SpectralMaskConfiguration with properties:
    
                EnabledMasks: 'upper'
                   UpperMask: [6x2 double]
                   LowerMask: -Inf
              ReferenceLevel: 'custom'
        CustomReferenceLevel: 0
         MaskFrequencyOffset: 0
    
      Events for class SpectralMaskConfiguration: MaskTestFailed


    Run the spectrum analyzer using a sine wave spectrum. In the Spectral Mask panel at the bottom of the Spectrum Analyzer window, see how the spectrum succeeded or failed to stay within the spectral mask.

    sine = dsp.SineWave(Frequency=[98 100],SampleRate=1000);
    sine.SamplesPerFrame = 1024;   
    scope.SampleRate = sine.SampleRate;
    
    for i=1:100       
        scope(sine() + 0.05*randn(1024,2));
    end
    release(scope)

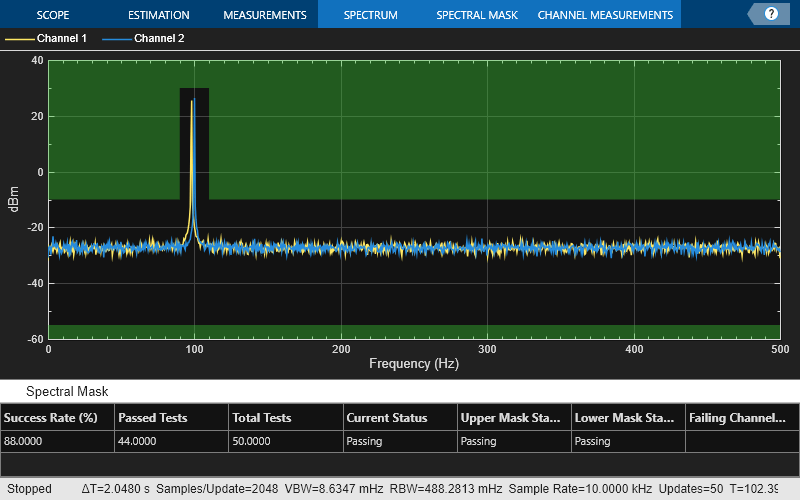
    Add a spectral mask to an existing spectrumAnalyzer object. Use the getSpectralMaskStatus function to get the spectral mask status.

    sine = dsp.SineWave(Frequency=[98 100],SampleRate=1000);
    sine.SamplesPerFrame = 1024;   
    scope = spectrumAnalyzer(SampleRate=sine.SampleRate,...
           PlotAsTwoSidedSpectrum=false,ShowLegend=true,YLimits=[-60 40]);
    hide(scope);
    
    scope.SpectralMask.EnabledMasks = "upper-and-lower";
    upperMask = [0 -10; 90 -10; 90 30; 110 30; 110 -10; 500 -10];
    set(scope.SpectralMask,UpperMask=upperMask,LowerMask=-55);
    
    for i=1:100       
        scope(sine() + 0.05*randn(1024,2));
    end
    
    res = getSpectralMaskStatus(scope)
    res = struct with fields:
        IsCurrentlyPassing: 1
            NumPassedTests: 44
             NumTotalTests: 51
               SuccessRate: 86.2745
              FailingMasks: ''
           FailingChannels: [1x0 double]
            SimulationTime: 102.3990


    You can also view the status in the Spectral Mask tab on the Spectrum Analyzer toolstrip.

    show(scope);
    release(scope);

    Version History

    Introduced in R2022a