示波器和数据记录
DSP 示波器使用仿硬件的界面来可视化实时流数据。使用测量、游标、触发器和封装以可视化方式检查和分析流数据。在 MATLAB® 中,您可以使用示波器 System object 来可视化流数据。示波器在 Simulink® 中,您可以使用示波器模块或 App 来可视化信号,也可以使用 Time Scope 或 To Workspace 模块将数据保存到 MATLAB。

模块
函数
App
| 逻辑分析仪 | 可视化、测量并分析一段时间内的转移和状态 |
主题
示波器配置
- 以编程方式控制 Scope 模块 (Simulink)
此示例说明如何使用编程脚本控制示波器。 - Common Scope Block Tasks
Step-by-step procedures of common scope tasks, including logging data, sharing scope images, and display manipulation. - Configure Spectrum Analyzer
Customize Spectrum Analyzer properties, set up spectral masks, and use measurement tools. - Configure Array Plot
Customize Array Plot properties and use measurement tools. - Configure Filter Visualizer
Customize Filter Visualizer properties and use measurement tools. - Configure Time Scope Block
Customize Time Scope properties and use measurement tools. - Configure Time Scope MATLAB Object
Customizetimescopeproperties and use measurement tools. - Configure Logic Analyzer
Adjust setting in the Logic Analyzer.
示波器工作流
- Display Frequency-Domain Data in Spectrum Analyzer
This example shows how you can use a Spectrum Analyzer block to display the frequency content of two frame-based signals simultaneously. - Visualize Central Limit Theorem in Array Plot
This example shows how to use and configure thedsp.ArrayPlotSystem object™ to visualize the Central Limit Theorem. - Inspect and Measure Transitions Using the Logic Analyzer
Learn the basics of the Logic Analyzer. - Time Scope Measurements
This example shows how to measure performance characteristics of a pulse width modulated sinusoid. - 频谱分析仪测量
此示例说明如何使用 Spectrum Analyzer 模块进行谐波失真测量(如 THD、SNR、SINAD 和 SFDR)、三阶互调 (TOI) 失真测量和相邻通道功率比 (ACPR) 测量。该示例还说明如何使用频谱图和自动峰值检测来查看时变频谱。该示例包括五个放大器模型,每个模型表示执行其中一种测量的典型设置。 - Use Peak Finder to Find Heart Rate from ECG Input
This example shows how to use the Time Scope Peak Finder panel to measure the heart rate from an ECG. - Obtain Measurements Data Programmatically for spectrumAnalyzer object
Obtain measurements data fromspectrumAnalyzerobject. - Obtain Measurements Data Programmatically for Spectrum Analyzer Block
Obtain measurements data from Spectrum Analyzer block.
数据记录
- Sample- and Frame-Based Concepts
Explore basic signal concepts in the context of a Simulink model. Learn more about sample-based processing and frame-based processing. - 使用信号记录保存信号数据 (Simulink)
通过标记要在模型中记录的信号,从仿真中捕获信号数据。 - Common Scope Block Tasks
Step-by-step procedures of common scope tasks, including logging data, sharing scope images, and display manipulation. - Import and Export Signals for Sample-Based Processing
Import signals from the MATLAB workspace into your DSP model and export signals from your signal processing model to the MATLAB workspace. The signals are configured for sample-based processing. - Import and Export Signals for Frame-Based Processing
Import signals from the MATLAB workspace into your signal processing model and export signals from your signal processing model to the MATLAB workspace. The signals are created for frame-based processing.
精选示例
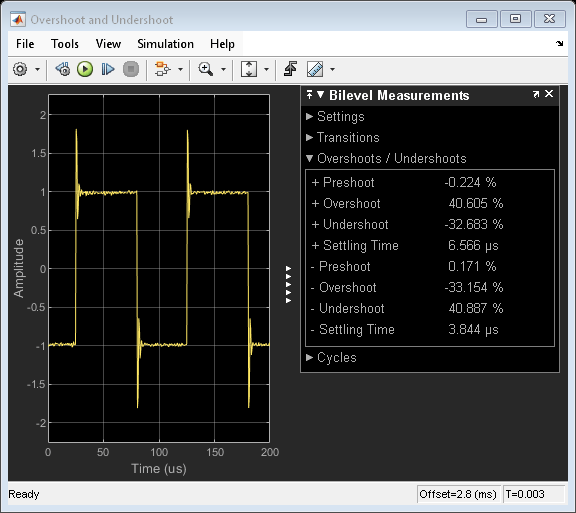
Time Scope Measurements
Measure performance characteristics of a pulse width modulated sinusoid. The example contains a model, which you can modify to view the effects of parameter changes on rise time, fall time, overshoot, undershoot, pulse width, pulse period, and duty cycle measurements. The example also models a rising edge trigger and you can perform basic statistical operations (mean, median, RMS, maximum, minimum) and measure the frequency and period of the pulse period via cursors and peak finding.
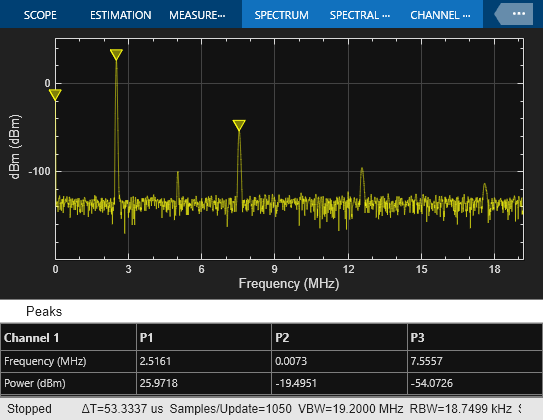
频谱分析仪测量
此示例说明如何使用 Spectrum Analyzer 模块进行谐波失真测量(如 THD、SNR、SINAD 和 SFDR)、三阶互调 (TOI) 失真测量和相邻通道功率比 (ACPR) 测量。该示例还说明如何使用频谱图和自动峰值检测来查看时变频谱。该示例包括五个放大器模型,每个模型表示执行其中一种测量的典型设置。