Main Content

getSpectrumData

Save spectrum data shown in spectrum analyzer

Description

example

spectrumTable = getSpectrumData(scope) returns the spectrum and spectrogram displayed on the spectrum analyzer along with additional statistics about the spectrum.

Examples

collapse all

Create a Spectrum Analyzer object and generate data.

scope = spectrumAnalyzer;
scope(randn(6000,3))

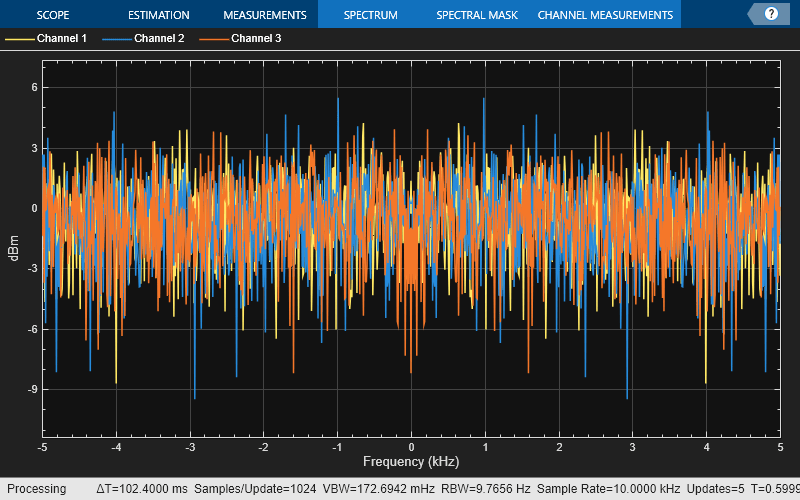
Save data from the last spectrum shown in the Spectrum Analyzer to a table.

specTable = getSpectrumData(scope)
specTable =

  1x3 table

    SimulationTime       Spectrum        FrequencyVector
    ______________    _______________    _______________

      {[0.5999]}      {1024x3 double}    {1024x1 double}

Input Arguments

collapse all

Spectrum Analyzer you want to query, specified as one of the following:

Output Arguments

collapse all

A spectrum table is returned containing the following fields:

FieldDescription
SimulationTimeSimulation time
SpectrumPower, power density, or RMS spectrum data
SpectrogramSpectrogram data
MinHoldTraceMinimum hold trace data
MaxHoldTraceMaximum hold trace data
FrequencyVectorFrequency vector

Version History

Introduced in R2017b

expand all