Write Callbacks to Analyze Safety Analysis Manager Fault Tree Documents
R2026bYou can use callbacks in the Safety Analysis Manager to analyze the status of your fault tree documents and populate the content by reassigning values or adding flags. You can run callbacks manually or automatically.
Create Callbacks
To create a callback:
Open or create a Safety Analysis Manager fault tree document. For more information on creating fault tree documents, see Create Fault Trees in the Safety Analysis Manager.
In the Analyze section, click Edit Callbacks. The Callbacks Editor window opens.
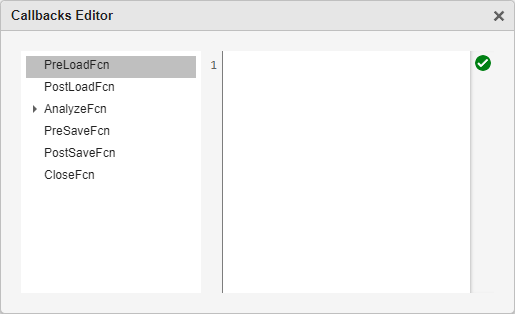
Enter your script in one or more of these callback types:
Callback Type When Executed PreLoadFcn Before the fault tree document loads PostLoadFcn After the fault tree document loads AnalyzeFcn When you click Analyze Document or press F5 PreSaveFcn Before the fault tree document is saved PostSaveFcn After the fault tree document is saved CloseFcn Before the fault tree document is closed Exit the Callbacks Editor window to save the callbacks.
You can write scripts manually in the Callback Editor window or write scripts that execute other MATLAB® files on path.
Note
When you execute the callback, the code runs in the MATLAB base workspace. Consequentially, if you define variables in a callback that are already defined in the base workspace, executing the callback overwrites those variables.
The AnalyzeFcn callback type includes a default callback that is always enabled. You can also add custom AnalyzeFcn callbacks that you can enable or disable. See Create and Select Custom Callbacks for Safety Analysis Manager Fault Tree Documents.
Modify Fault Tree Documents with Keywords
To modify a fault tree document by using a callback, retrieve the
FaultTreeDocument object by using the
sfa_document keyword. For example, this code retrieves the
FaultTreeDocument object and stores it in the variable
x.
x = sfa_document;
If you write MATLAB files and call them in the callback, the files cannot use this keyword.
Add Flags to Fault Tree Documents
Use flags to visually indicate errors, warnings, and checks. In fault tree documents, you can add multiple flags to events, gates, and failure models. You can use callbacks to add flags to your fault tree artifacts in any of the fault trees in the fault tree document.
To add flags to a fault tree document artifact by using a callback:
Retrieve the
FaultTreeDocumentobject by using thesfa_documentkeyword.Retrieve the event, gate, or failure model from the tree by accessing the
Events,Gates, orFailureModelsproperty of theFaultTreeDocument.Add the flag by using the
addFlagfunction on theEvent,Gate, orFailureModelobject.
Fault trees documents support these flags.
| Flag Type | Description |
|---|---|
| Error | An error flag. Events, gates, and failure models with an error flag display the error icon . |
| Warning | A warning flag. Events, gates, and failure models with a warning flag display the warning icon . |
| Check | A check flag. Events and gates, and failure models with a check flag display the check icon . |
After you add flags, the Safety Analysis Manager displays the flags directly on the artifact.
View in a List
You can view flags in the whole document or for a selected artifact. To view a list of the flags in the fault tree document, click the Fault Tree Document tab in the Properties pane and expand the Flags section. For example, this image shows the Fault Tree Document tab in a document that contains two flags assigned to a gate, and two flags assigned to events.
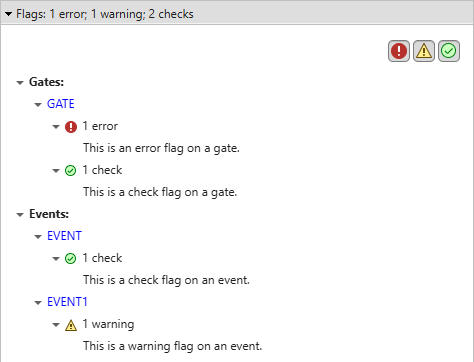
To view the flags on a single artifact, select the event, gate, or failure model, open the Event, Gate, or Failure Model tabs, and expand the Flags section. You can select the artifact in the diagram or in the Artifacts pane. You can also filter the flags by their type by selecting from the flag icons in the top-right corner.
When you run callbacks in the AnalyzeFcn parameter, the Safety Analysis Manager clears the flags from the fault tree document before executing the script. To manually clear the flags without running the callback, in the Analyze section, click Clear Flags. To clear individual flags, in the Properties pane, in the Flags section, select the flag and press Delete on your keyboard. To delete multiple flags, select the flag type, event label, or gate label, and press Delete on your keyboard.
Note
Flags exist only when the fault tree document is open. When you close the fault tree document, the Safety Analysis Manager deletes the flags, even if you saved the spreadsheet.
Fault Tree Document Callback Example
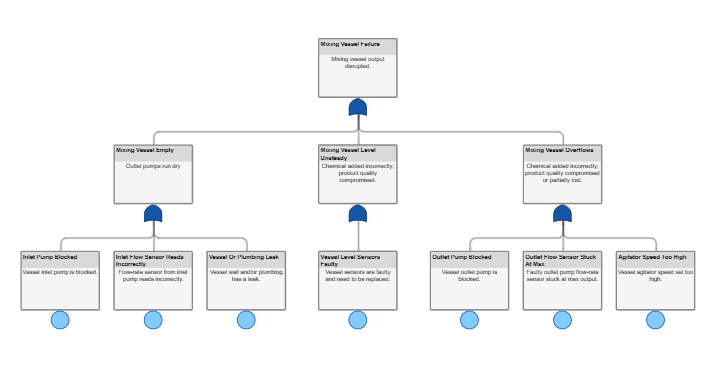
This example runs a callback on a Safety Analysis Manager fault tree, and adds flags to events based on their configuration. Open the MixingVessel_FaultTree.mldatx file to view the fault tree.
The fault tree assesses possible failures in the volume control of a mixing vessel. The vessel takes in liquid from an inlet pump, mixes it with other products, and then expels the new solution through an outlet pump. The vessel must maintain a steady mixing volume by consistently taking in as much liquid as it expels.
Inspect the Fault Tree Structure
To represent the failure of the mixing vessel, the fault tree has three failure modes. Each failure mode is represented by a gate under the top-level event, Mixing Vessel Process Failure. These modes of failure can be caused by several basic events, each of which have different failure properties. Because any one event for each failure model can contribute to the total failure of the vessel, each gate is an OR gate.
The fault tree contains these failure modes, and the events that cause them:
Mixing Vessel Empty* - The inlet pump is blocked, the inlet flow sensor is faulty, or the plumbing is leaking.
Mixing Vessel Level Unsteady - The vessel level sensors are faulty.
Mixing Vessel Overflows - The outlet pump is clogged, the outlet flow sensor is stuck at max, or the agitator speed too high.
To indicate the failure and cause, each gate and event uses a description and label.
Inspect the Callback
To check the formatting of the fault tree, the fault tree includes an AnalyzeFcn callback that executes when you analyze the fault tree. Open the callback to view the code. In the Analyze section, click Edit Callbacks and select AnalyzeFcn. Running the callback clears the existing flags and then adds flags based on these conditions:
If the event does not have a label, add a warning flag that tells the user to add a label.
If the event does not have a description, add a warning flag that tells the user to add a description.
If the failure model assigned to the event has a parameter value equal to zero, add an error flag that tells the user to set the failure model parameters.
Otherwise, add a check flag that tells the user that the event is configured correctly.
Analyze the Fault Tree
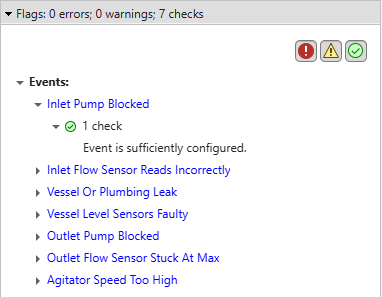
Click Analyze Document to run the callback. Each event has a check flag, indicating that the events comply with the analysis requirements.

The Artifacts pane displays the events and the flags in the fault tree. Expand each event to view the flags.
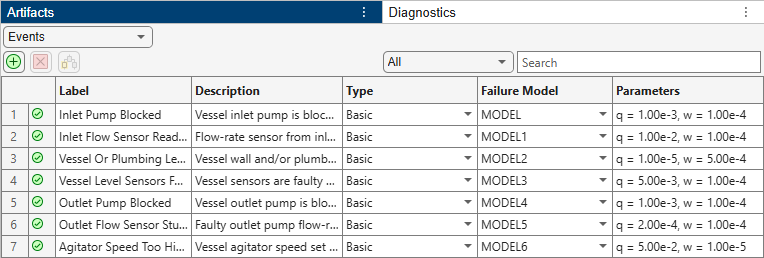
You can also view the properties in the Properties pane.
To view different flag outputs, adjust the event labels, descriptions, or failure model parameters and rerun the analysis.
See Also
Apps
Functions
addFlag|clear|clearFlags|getFlags|runAnalysis

