chargeChart
Syntax
Description
chargeChart( creates a chart of
portfolio market risk capital charge values. Each charge value can be broken down into
contributions from the default risk capital charge (DRC), residual risk add-on capital
charge (RRAO), and sensitivity-based market risk capital charge (SBM). For more
information on market risk capital charge, see Charge.frtbsaObj)
chargeChart(
creates a chart of portfolio market risk capital charge values using optional name-value
arguments.frtbsaObj,Name=Value)
Examples
Use an frtbsa object and the chargeChart function to plot the total capital market risk charge for each portfolio. FRTB-SA (Standardized Approach for Fundamental Review of Trading Book) is a Basel Committee on Banking Supervision framework for calculating market capital risk requirements. This framework is based on a set of standardized risk factors.
Create frtbsa Object
Use bank format to display numeric data using two decimal places.
format bankDefine the ISDA® FRTB-SA CRIF file.
FRTBSACRIF = "FRTBSA_CRIF.csv";Define the DRC reference date.
DrcRefCOBDate = datetime(2023,9,21);
Use frtbsa to create the FRTB-SA object.
myFRTBSA = frtbsa(FRTBSACRIF,DRCValuationDate=DrcRefCOBDate)
myFRTBSA =
  frtbsa with properties:

                CRIF: [159×18 table]
       NumPortfolios: 2.00
        PortfolioIDs: [2×1 string]
          Portfolios: [2×1 frtbsa.Portfolio]
          Regulation: "Basel"
    DomesticCurrency: "USD"
    DRCValuationDate: 21-Sep-2023
         NumDaysYear: 365.00
Generate Charge Charts
To plot the total portfolio market risk capital charge values, use chargeChart with the Style name-value argument set to "final".
chargeChart(myFRTBSA,Style="final")
To plot the breakdown of the market risk capital charge components, use chargeChart with the Style name-value argument set to "component".
chargeChart(myFRTBSA,Style="component")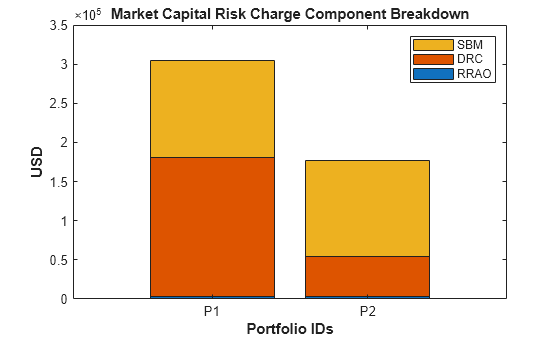
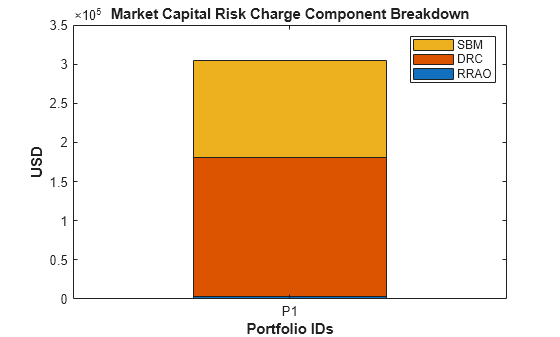
To plot the breakdown of the market risk capital charge components for a subset of portfolios using the IDs name-value argument, use chargeChart with the Style name-value argument set to "component".
chargeChart(myFRTBSA,Style="component",IDs = "P1")
Specify "pie" for Style to create a breakdown of pie charts by its components: DRC, RRAO, and SBM.
ax = gca;
chargeChart(myFRTBSA,Style="pie",Parent=ax)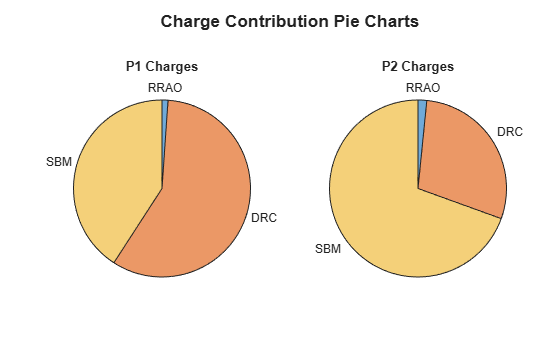
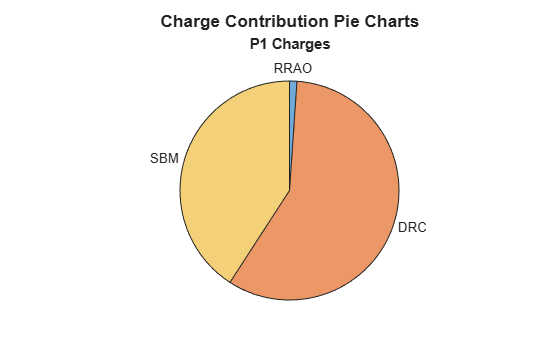
Plot a subset of portfolios using the IDs name-value argument.
figure
chargeChart(myFRTBSA,Style="pie",IDs="P1")
Input Arguments
Name-Value Arguments
Output Arguments
References
[1] Bank for International Settlements. "MAR21 — Standardised Approach: Sensitivities-Based Method." March 2020. https://www.bis.org/basel_framework/chapter/MAR/21.htm.
[2] Bank for International Settlements. "MAR22 — Standardised Approach: Default Risk Capital Requirement." March 2020. https://www.bis.org/basel_framework/chapter/MAR/22.htm.
[3] Bank for International Settlements. "MAR23 — Standardised Approach: Residual Risk Add-On." March 2020. https://www.bis.org/basel_framework/chapter/MAR/23.htm.
[4] Bank for International Settlements. "CRE42 — Securitisation: External-Ratings-Based Approach (SEC-ERBA)." January 2023. https://www.bis.org/basel_framework/chapter/CRE/42.htm.
[5] Bank for International Settlements. "Basel Committee on Banking Supervision: Minimum Capital Requirements for Market Risk." January 2019. https://www.bis.org/bcbs/publ/d457.pdf.