errpdf
量化误差的概率密度函数
语法
[f,x] = errpdf(q)

f = errpdf(q,x)
说明
[f,x] = errpdf(q) 返回在 x 中的值处计算的概率密度函数 f。向量 x 包含通过 quantizer 对象 q 量化信号而产生的均匀分布随机量化误差。
f = errpdf(q,x) 返回在向量 x 中的值处计算的概率密度函数 f。
注意
当信号精度接近 quantizer 的精度时,结果不精确。
示例
q = quantizer('nearest',[4 3]);
[f,x] = errpdf(q);
subplot(211)
plot(x,f)
title('Computed PDF of the quantization error.')
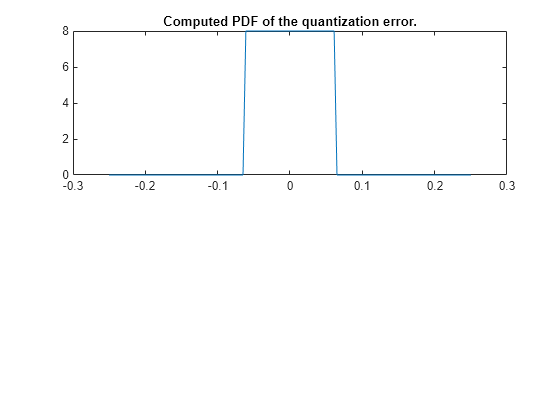
输出绘图显示量化误差的概率密度函数。将此结果与蒙特卡罗试验的样本概率密度函数绘图进行比较:
 r = realmax(q);
      u = 2*r*rand(10000,1)-r;  % Original signal
      y = quantize(q,u);        % Quantized signal
      e = y - u;                % Error
      subplot(212)
      hist(e,20)
      gca.xlim = [min(x) max(x)];
      title('Estimate of the PDF of the quantization error.')
版本历史记录
在 R2008a 中推出