tracking.scenario.airplaneMesh
Mesh representation of airplane
Description
mesh = tracking.scenario.airplaneMeshextendedObjectMesh object
defining an airplane mesh that can be used with the trackingScenario
object.
Examples
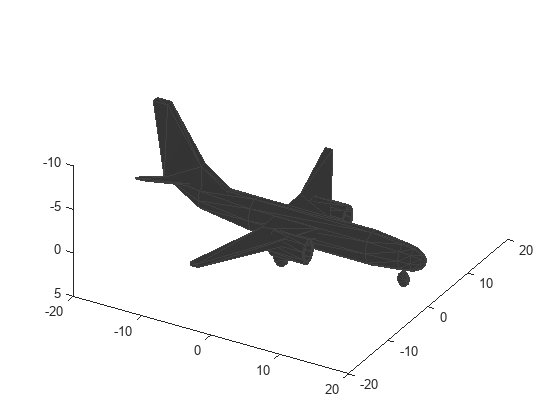
Create the airplane mesh.
mesh = tracking.scenario.airplaneMesh;
Visualize the mesh.
ax = axes('ZDir','reverse');
show(mesh,ax);
view(30,50);
Create a tracking scenario object and an airplane mesh object.
scene = trackingScenario;
mesh = tracking.scenario.airplaneMesh;
Create two tower platforms.
% Create the first tower.
tower = platform(scene);
h = 50;
tower.Trajectory.Position = [0 0 -h];
tower.Dimensions = struct('Length',10,'Width',10,'Height',h,'OriginOffset',[0 0 -h/2]);
tower.Sensors = monostaticLidarSensor('SensorIndex',1,...
    'MaxRange',200,...
    'HasINS',true,...
    'DetectionCoordinates','scenario',...
    'AzimuthLimits',[-75 75],...
    'ElevationLimits',[-10 30]);

% Create the second tower.
tower2 = platform(scene);
h = 50;
tower2.Trajectory.Position = [0 500 -h];
tower2.Dimensions = struct('Length',10,'Width',10,'Height',h,'OriginOffset',[0 0 -h/2]);
tower2.Sensors = monostaticLidarSensor('SensorIndex',2,...
    'MaxRange',200,...
    'HasINS',true,...
    'DetectionCoordinates','scenario',...
    'AzimuthLimits',[-75 75],...
    'ElevationLimits',[-10 30]);
Create the airplane target with associated mesh.
airplane = platform(scene);
airplane.Mesh = mesh;
% Set the dimensions of the plane which automatically adjust the size of the mesh.
airplane.Dimensions = struct('Length',40,...
    'Width',40,...
    'Height',12.5,...
    'OriginOffset',[0 0 12.5/2]);
Create a landing trajectory for the plane.
x = 50*ones(10,1);
y = linspace(-500,1000,10)';
yToLand = max(0,-y);
z = -1e4*(2.*(yToLand./50e3).^3 + 3*(yToLand./50e3).^2);
wps = [x y z];
toa = linspace(0,30,10)';
traj = waypointTrajectory(wps,toa);
airplane.Trajectory = traj;
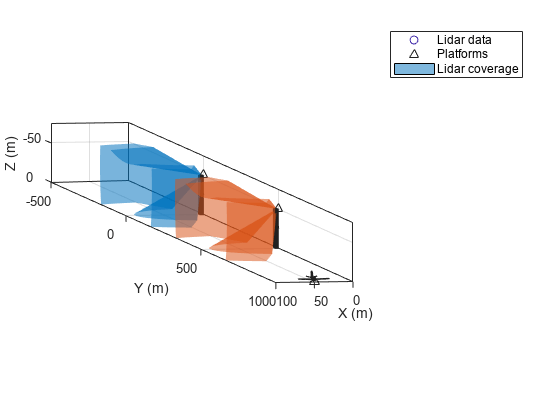
Create a plotter to visualize the scenario.
lp = scatter3(nan,nan,nan,6,nan,'o','DisplayName','Lidar data');
tp = theaterPlot('Parent',lp.Parent,...
    'XLimits',[0 100],...
    'YLimits',[-500 1000],...
    'ZLimits',[-75 0]);
lp.Parent.ZDir = 'reverse';
view(lp.Parent,169,5);
pp = platformPlotter(tp,'DisplayName','Platforms','Marker','^');
cp = coveragePlotter(tp,'DisplayName','Lidar coverage');
hold on;
Advance the simulation, generate data, and visualize the results.
scene.UpdateRate = 0; % Automatic update rate
while advance(scene)
    % Generate point cloud.
    ptCloud = lidarDetect(scene);

    % Obtain coverage configurations.
    cfgs = coverageConfig(scene);

    % Plot coverage.
    cp.plotCoverage(cfgs);

    % Plot platforms.
    platPoses = platformPoses(scene);
    pos = vertcat(platPoses.Position);
    mesh = cellfun(@(x)x.Mesh,scene.Platforms);
    orient = vertcat(platPoses.Orientation);
    pp.plotPlatform(pos,mesh,orient);

    % Concatenate all point clouds.
    s = vertcat(ptCloud{:});
    % Plot lidar data.
    set(lp,'XData',s(:,1),...
        'YData',s(:,2),...
        'ZData',s(:,3),...
        'CData',s(:,3));
    drawnow;
end
Output Arguments
Version History
Introduced in R2020b