Import Satellite TLE Data Using Tracking Data Importer App
R2026bThis example shows how to import satellite trajectory data from a Two-Line Element (TLE) file into the Tracking Data Importer app. You then propagate satellite orbits to generate a truth data table, import it into the app, and map, convert, and visualize the satellite trajectories on a globe.
Generate Truth Data
Read the TLE file containing a LEO satellite constellation using the tleread (Aerospace Toolbox) function. The TLE file used in this example contains orbital elements for 40 satellites.
tleData = tleread("leoSatelliteConstellation.tle");
numSatellites = numel(tleData);
Define a time vector starting from the TLE epoch and spanning 200 minutes with 1-minute intervals. This defines approximately two orbital periods for satellites in low Earth orbit (LEO).
startTime = tleData(1).Epoch;
dt = minutes(0:1:200)';
time = startTime + dt;
Propagate the orbit for satellites using propagateOrbit (Aerospace Toolbox) with the OutputCoordinateFrame set to "geographic". This returns positions as latitude, longitude, and altitude, and velocities in the local NED (North-East-Down) frame.
% Compute positions and velocities of satellites at defined time
% intervals
[pos, vel] = propagateOrbit(time, tleData, ...
    OutputCoordinateFrame="geographic");

% Timestamp vector of same size as number of positions
timestamps = repmat(time,1,numel(tleData));

% Names at all timestamps
satelliteNames = repmat([tleData.Name],numel(time),1);

% Generate a truth table
satelliteData = table( ...
    timestamps(:), ...% Time
    satelliteNames(:), ...% Name
    pos(1,:)', pos(2,:)', pos(3,:)', ...% LLA
    vel(1,:)', vel(2,:)', vel(3,:)', ...% Velocity
    VariableNames=["time",...
                   "name", ...
                   "lat","long","alt", ...
                   "v_n","v_e","v_d"]);
Preview the generated truth data table.
head(satelliteData)
            time                name           lat       long         alt         v_n       v_e        v_d
    ____________________    _____________    _______    _______    __________    ______    ______    ________

    04-May-2020 18:45:35    "Satellite 1"    -9.3845    -148.96     8.503e+05    6063.9    3766.9      5.1694
    04-May-2020 18:46:35    "Satellite 1"    -6.4786    -147.16    8.5002e+05      6085    3733.4      3.9586
    04-May-2020 18:47:35    "Satellite 1"     -3.564    -145.38    8.4982e+05    6098.2    3712.4      2.6927
    04-May-2020 18:48:35    "Satellite 1"    -0.6447    -143.62     8.497e+05    6103.8    3703.6      1.3944
    04-May-2020 18:49:35    "Satellite 1"     2.2755    -141.86    8.4965e+05    6101.7      3707    0.086615
    04-May-2020 18:50:35    "Satellite 1"     5.1927    -140.08    8.4969e+05      6092    3722.8     -1.2074
    04-May-2020 18:51:35    "Satellite 1"     8.1032     -138.3     8.498e+05    6074.6    3750.9     -2.4649
    04-May-2020 18:52:35    "Satellite 1"     11.003    -136.48    8.4998e+05    6048.9    3791.5     -3.6635
Import and Map Data
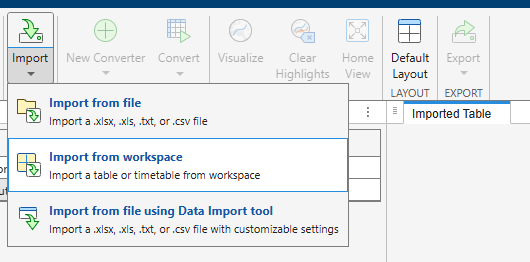
Launch the Tracking Data Importer application by using the trackingDataImporter command. In the app, click the Import button and select Import from workspace.
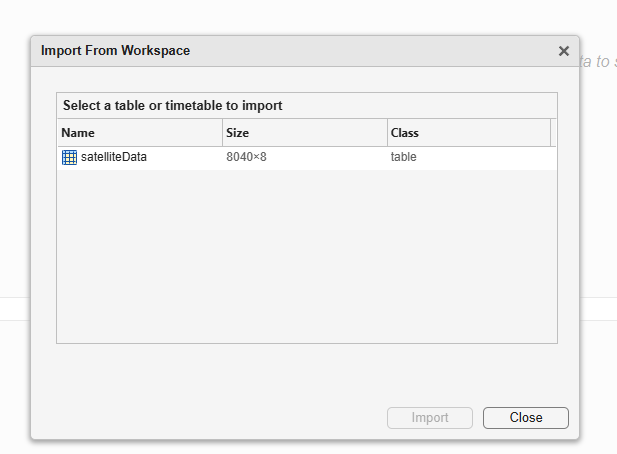
Select the satelliteData table as shown in the picture below.
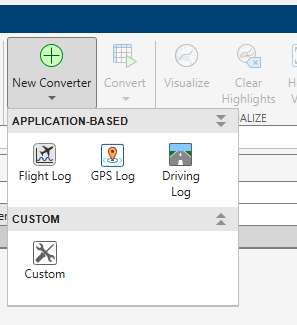
Click the New Converter button and select Custom to create a converter that maps the table columns to the data elements required by the importer.
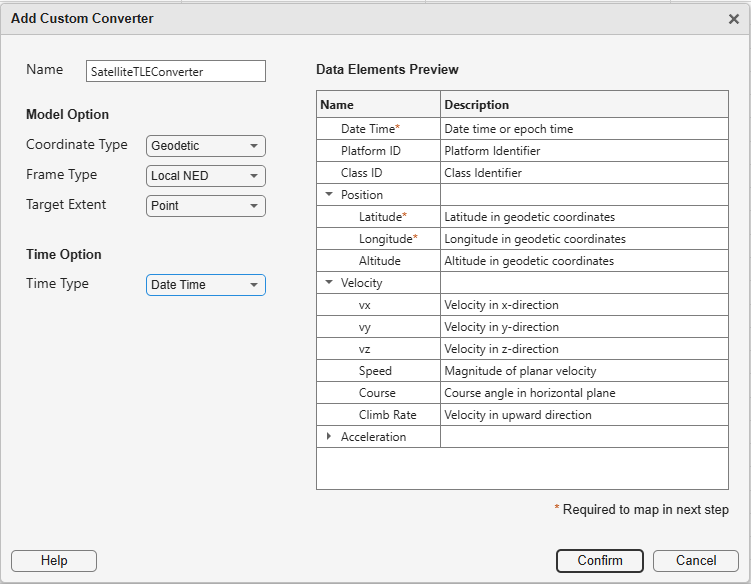
Provide a name for the converter (for example, SatelliteDataConverter) to identify it for future use. You also configure the converter to match the satellite truth data generated in the previous section. You choose Coordinate Type as Geodetic because the satellite position was obtained in geographic coordinates using the propagateOrbit function. You also configure Frame Type as Local NED because the satellite velocity was recorded in the local NED frame.
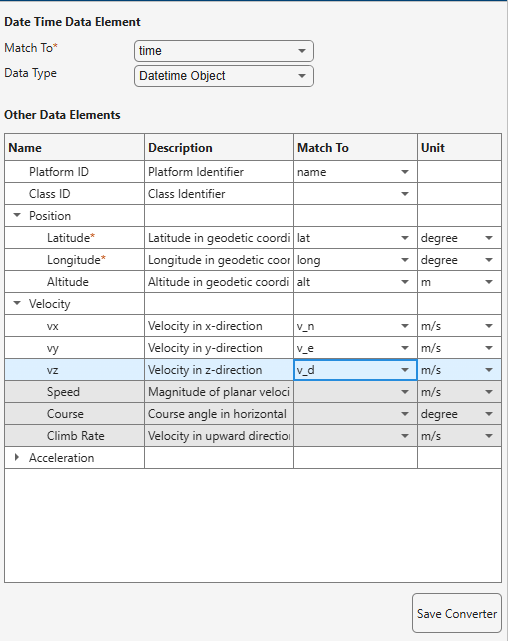
Click Confirm, and then map the state elements as shown in the picture below. First, map the Date Time Data Element to match the time column in the table. Then, select the appropriate table column in the Match To column of each field in the Other Data Elements table.
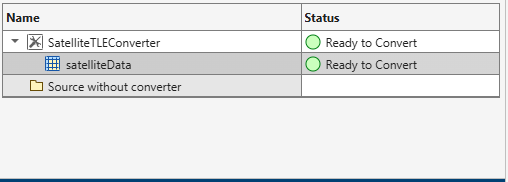
Click Save Converter to save the converter. Verify that the data is Ready to Convert in the panel above.
Convert Data
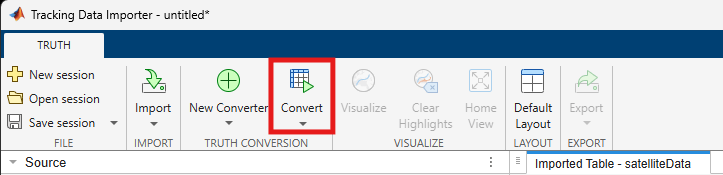
After mapping, click the Convert button to convert the raw imported data to the required formats.
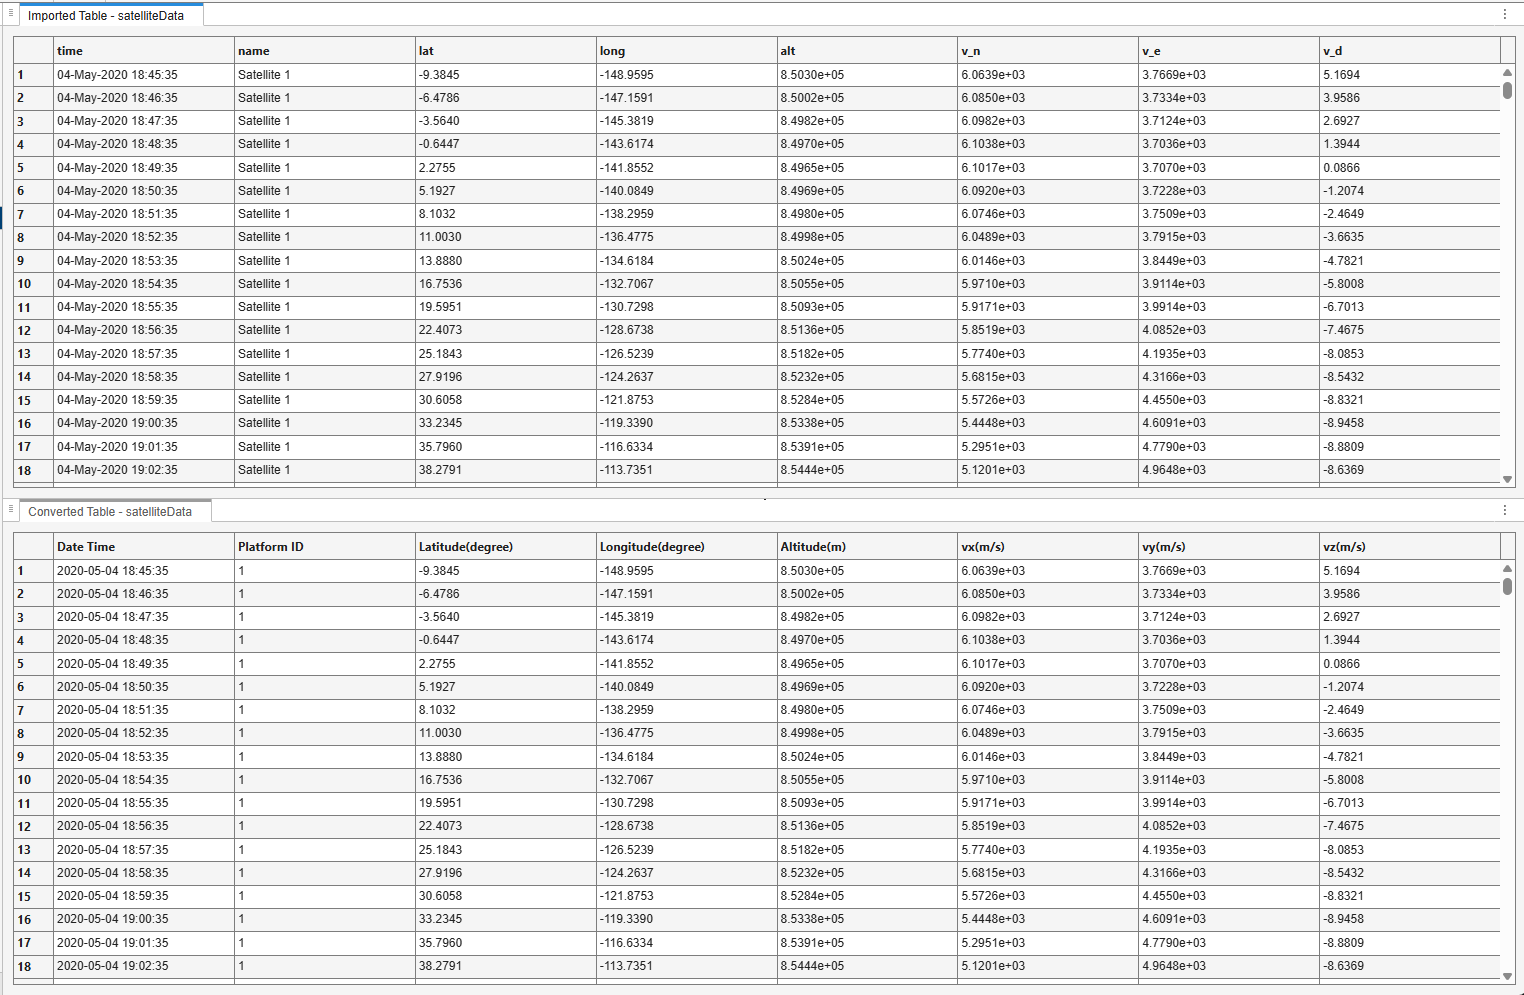
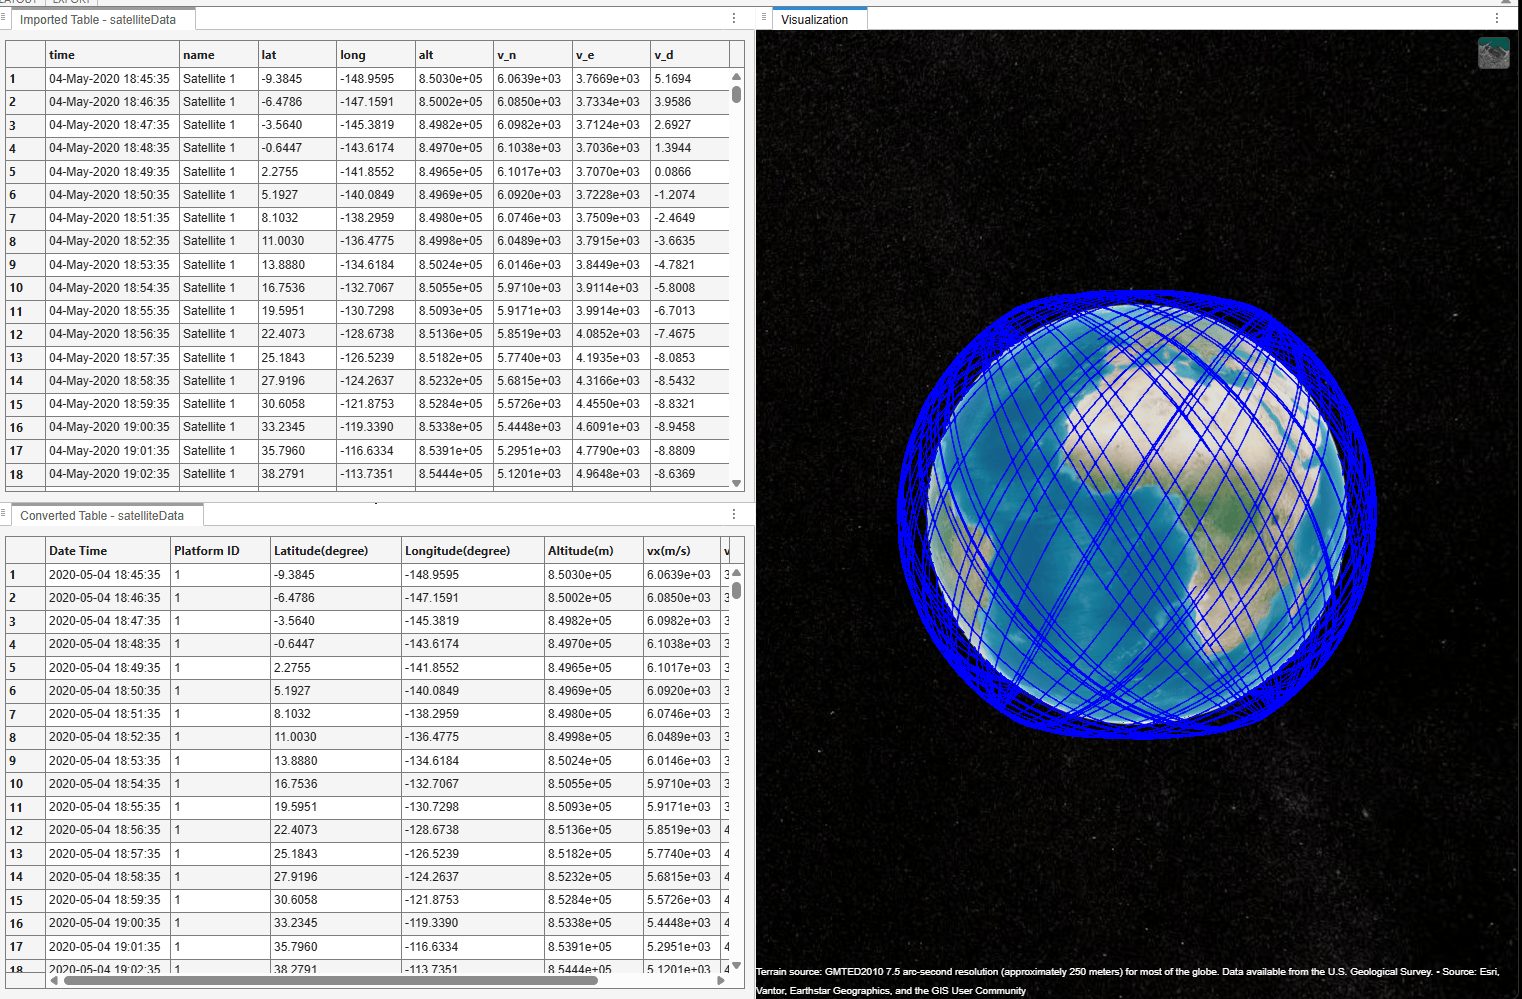
During conversion, the app validates the mapping and creates a converted data table with position and velocity in the local NED reference frame. You should see a converted table at the bottom after successful conversion.
Visualize Data
Click the Visualize button to visualize the satellite trajectories on an interactive globe-based visual.

This opens the visualization panel and shows the trajectory of each satellite orbit in the data on the globe in blue.
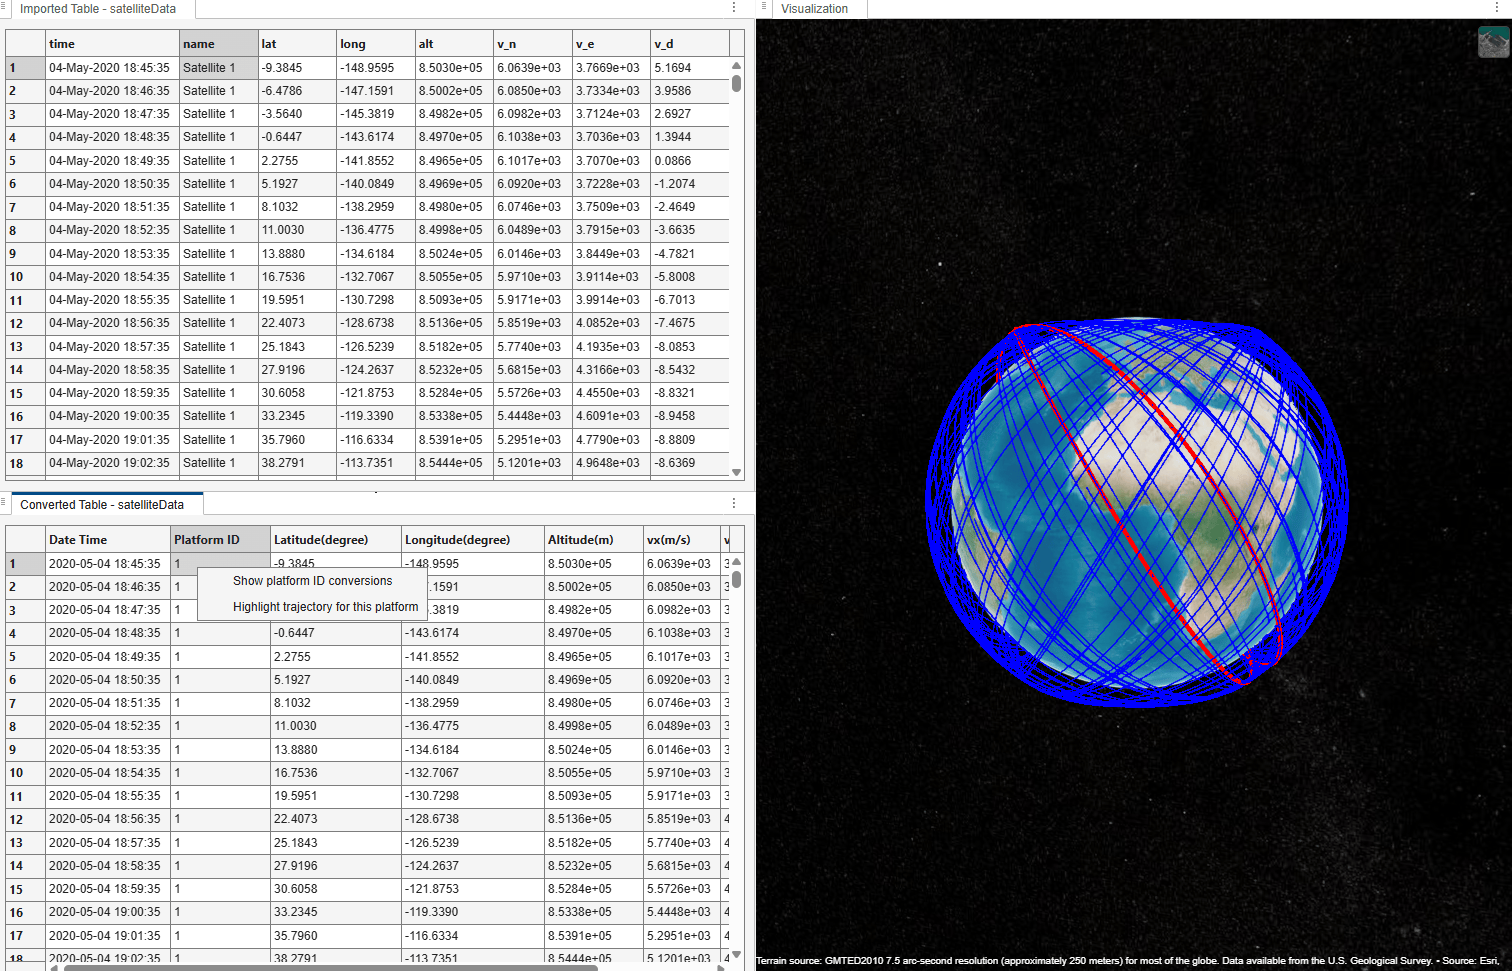
You can also interact with the data table to highlight and inspect the trajectory of a specific satellite.
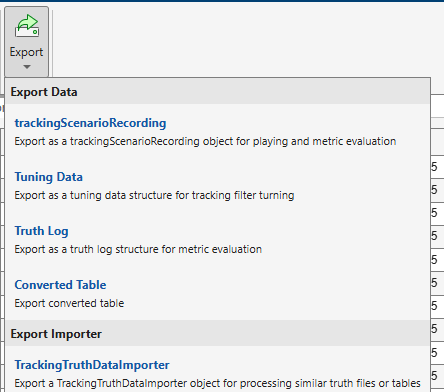
You can further export the data to complete tracking tasks such as Create Tracking Scenario Using Imported ADS-B Data using this as ground truth, tuning a filter, or evaluating a tracker's performance.
Summary
In this example, you learned how to import TLE data for tracking use cases by first generating a truth table, and then importing it using the Tracking Data Importer app. For more details on how to use the app, refer to the documentation of the Tracking Data Importer app.

