Identify Function Calls That Prevent Kernel Creation
Only the CPU can launch kernels, manage CPU memory, or call host functions in generated CUDA® code. If a loop contains one of these operations, GPU Coder™ cannot generate a CUDA kernel for it. Instead, GPU Coder generates a CPU loop, which can increase the execution time of the generated code. For example, the generated code uses the CPU for these function calls:
Calls to functions from the NVIDIA® cuFFT, cuBLAS, or cuSolver libraries
Calls to functions that allocate or free CPU memory
Calls to the
coder.cevalfunction that do not use the-gpudevicefcnoption
To detect function calls that prevent GPU Coder from generating a kernel, use the GPU Performance Analyzer.
Generate and Profile Code
The GPU Performance Analyzer flags loops that execute for a significant
part of the total runtime, and reports the reason that GPU Coder did not generate a kernel. For example, consider the function
mySquare. The function accepts a 1024-by-3 matrix and returns a
1024-by-1 vector, where each entry is the sum of the squares of each 1-by-3 row vector in
the original matrix. The function uses the dot function to compute the
result.
function output = mySquare(input)
output = coder.nullcopy(zeros(size(input,1),1));
for i = 1:numel(output)
    output(i) = dot(input(i,:),input(i,:));
end
end
Create a GPU code configuration object by using the coder.gpuConfig function. To generate code, profile the code, and open the
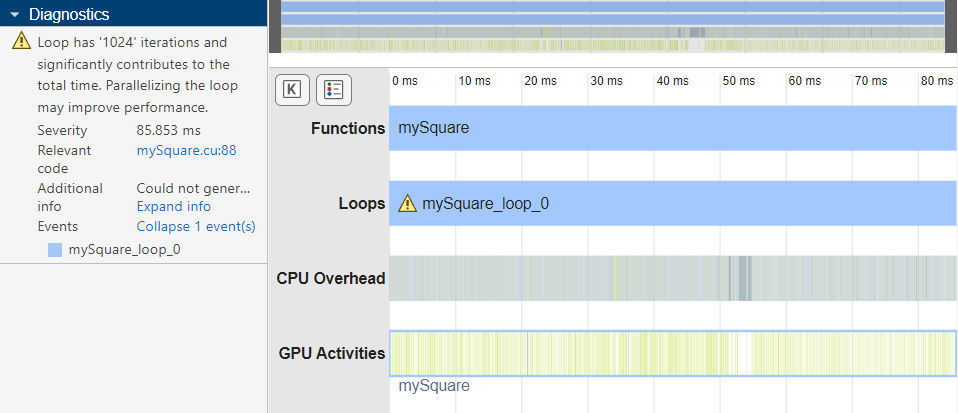
GPU Performance Analyzer, use the gpuPerformanceAnalyzer function. In this example, the Profiling
Timeline pane contains a warning icon for mySquare_loop_0,
and the Diagnostics pane reports that the loop significantly
contributes to the total run time.
input = rand(1024,3);
cfg = coder.gpuConfig("mex");
gpuPerformanceAnalyzer("mySquare",{input},Config=cfg);
Examine Performance Analyzer Diagnostic
In the Diagnostics pane, click Expand info.
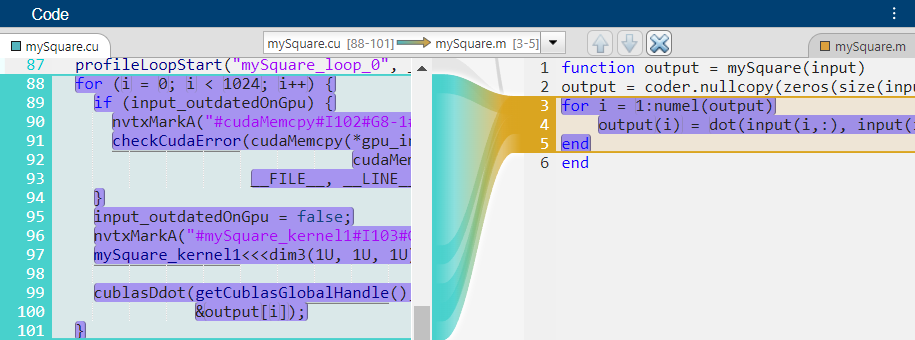
The analyzer reports that the loop contains an unsupported function call to
gpublasddot.
Could not generate kernel for loop: Loops has unsupported function call to 'gpublasddot'
To find the MATLAB® code that traces to this function call, first click the link in the
Relevant code section to the file mysquare.cu. The
Code pane shows the code for the loop in
mysquare.cu that calls cublasDdot, which is a GPU
function from the cuBLAS library.
cublasDdot(getCublasGlobalHandle(), 3, &(*gpu_a)[0], 1, &(*gpu_b)[0], 1,
               &output[i]);
Point to the loop in mysquare.cu. The code traces to the loop in the
MATLAB function, which contains a call to the MATLAB function dot.
Because the call to dot maps to the function
cublasDdot from the cuBLAS library, GPU Coder does not parallelize the loop that calls dot.
To map the loop to a CUDA kernel, rewrite the loop without using dot. In this
example, rewrite mySquare by using addition and exponentiation instead.
Save the new version as mySquare2.m.
function output = mySquare2(input)
    output = coder.nullcopy(zeros(size(input,1), 1));
    for i = 1:numel(output)
        output(i) = input(i,1)^2 + input(i,2)^2 + input(i,3)^2;
    end
end
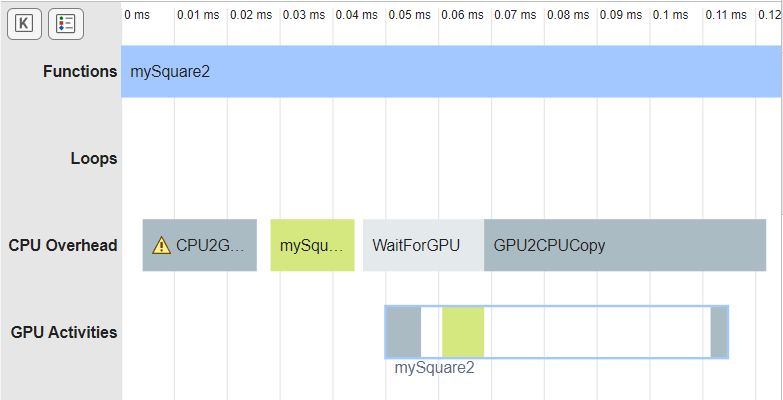
To check if the generated GPU code for the new function maps the loop to a kernel, generate code and profile it. The analyzer shows the generated code for the new version of the function contains a single kernel launch.
gpuPerformanceAnalyzer("mySquare2",{input},Config=cfg);