Representing Frequency-Response Data Using idfrd Objects
idfrd Constructor
The idfrd represents complex frequency-response
data. Before you can create an idfrd object, you must import your data as
described in Frequency-Response Data Representation.
Note
The idfrd object can only encapsulate one frequency-response data
set. It does not support the iddata equivalent of multiexperiment
data.
Use the following syntax to create the data object fr_data:
fr_data = idfrd(response,f,Ts)
Suppose that ny is the number of output channels,
nu is the number of input channels, and nf is a
vector of frequency values. response is an
ny-by-nu-by-nf 3-D array.
f is the frequency vector that contains the frequencies of the
response.Ts is the sample time, which is used when measuring or
computing the frequency response. If you are working with a continuous-time system, set
Ts to 0.
response(ky,ku,kf), where ky,
ku, and kf reference the kth
output, input, and frequency value, respectively, is interpreted as the complex-valued
frequency response from input ku to output ky at
frequency f(kf).
Note
When you work at the command line, you can only create idfrd
objects from complex values of
G(eiw). For a
SISO system, response can be a vector.
You can specify object properties when you create the idfrd object
using the constructor syntax:
fr_data = idfrd(response,f,Ts,
               'Property1',Value1,...,'PropertyN',ValueN)
idfrd Properties
To view the properties of the idfrd object, you can use the get command. The following example shows how to create an
idfrd object that contains 100 frequency-response values with a sample
time of 0.1 s and get its properties:
f = logspace(-1,1,100);
[mag, phase] = bode(idtf([1 .2],[1 2 1 1]),f);
response = mag.*exp(1j*phase*pi/180);
fr_data = idfrd(response,f,0.1);
get(fr_data)
      FrequencyUnit: 'rad/TimeUnit'
             Report: [1×1 idresults.frdest]
       SpectrumData: []
     CovarianceData: []
    NoiseCovariance: []
        InterSample: {'zoh'}
       ResponseData: [1×1×100 double]
            IODelay: 0
         InputDelay: 0
        OutputDelay: 0
          InputName: {''}
          InputUnit: {''}
         InputGroup: [1×1 struct]
         OutputName: {''}
         OutputUnit: {''}
        OutputGroup: [1×1 struct]
              Notes: [0×1 string]
           UserData: []
               Name: ''
                 Ts: 0.1000
           TimeUnit: 'seconds'
       SamplingGrid: [1×1 struct]
          Frequency: [100×1 double]
For a complete description of all idfrd object properties, see the
idfrd reference page.
To change property values for an existing idfrd object, use the
set command or dot notation. For example, to
change the name of the idfrd object, type the following command
sequence at the prompt:
fr_data.Name = 'DC_Converter';Select I/O Channels and Data in idfrd Objects
You can reference specific data values in the idfrd object using the following syntax:
fr_data(outputchannels,inputchannels)
Reference specific channels by name or by channel index.
Tip
Use a colon (:) to specify all channels, and use the empty matrix
([]) to specify no channels.
For example, the following command references frequency-response data from input channel
3 to output channel 2:
fr_data(2,3)
You can also access the data in specific channels using channel names. To list multiple channel names, use a cell array. For example, to retrieve the power output, and the voltage and speed inputs, use the following syntax:
fr_data('power',{'voltage','speed'})To retrieve only the responses corresponding to frequency values between
200 and 300, use the following command:
fr_data_sub = fselect(fr_data,[200:300])
You can also use logical expressions to subreference data. For example, to retrieve all
frequency-response values between frequencies 1.27 and
9.3 in the idfrd object
fr_data, use the following syntax:
fr_data_sub = fselect(fr_data,fr_data.f>1.27&fr_data.f<9.3)
Tip
Use end to reference the last sample number in the data. For
example, data(77:end).
Note
You do not need to type the entire property name. In this example,
f in fr_data.f uniquely identifies the
Frequency property of the idfrd object.
Adding Input or Output Channels in idfrd Objects
About Concatenating idfrd Objects
The horizontal and vertical concatenation of idfrd objects
combine information in the ResponseData properties of these objects.
ResponseData is an
ny-by-nu-by-nf array that
stores the response of the system, where ny is the number of output
channels, nu is the number of input channels, and nf
is a vector of frequency values (see the ResponseData property
description in idfrd).
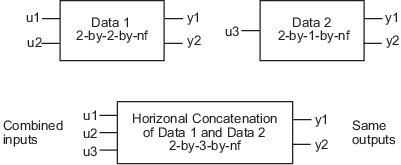
Horizontal Concatenation of idfrd Objects
The following syntax creates a new idfrd object data that contains the horizontal
concatenation of data1,data2,...,dataN:
data = [data1,data2,...,dataN]
data contains the frequency responses from all of the inputs in
data1,data2,...,dataN to the same outputs. The following diagram is a
graphical representation of horizontal concatenation of frequency-response data. The
(j,i,:) vector of the resulting response data represents the
frequency response from the ith input to the jth
output at all frequencies.
Note
Horizontal concatenation of idfrd objects requires that they
have the same outputs and frequency vectors. If the output channel names are different
and their dimensions are the same, the concatenation operation resets the output names
to their default values.
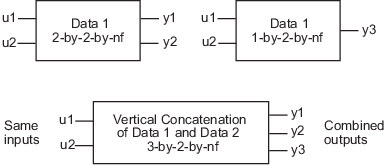
Vertical Concatenation of idfrd Objects
The following syntax creates a new idfrd object data that contains the vertical
concatenation of data1,data2,...,dataN:
data = [data1;data2;... ;dataN]
The resulting idfrd object data contains the
frequency responses from the same inputs in data1,data2,...,dataN to
all the outputs. The following diagram is a graphical representation of vertical
concatenation of frequency-response data. The (j,i,:) vector of the
resulting response data represents the frequency response from the ith
input to the jth output at all frequencies.
Note
Vertical concatenation of idfrd objects requires that they have
the same inputs and frequency vectors. If the input channel names are different and
their dimensions are the same, the concatenation operation resets the input names to
their default values.
Concatenating Noise Spectrum Data of idfrd Objects
When the SpectrumData property of individual
idfrd objects is not empty, horizontal and vertical concatenation
handle SpectrumData, as follows.
In case of horizontal concatenation, there is no meaningful way to combine the
SpectrumData of individual idfrd objects and the
resulting SpectrumData property is empty. An empty property results
because each idfrd object has its own set of noise channels, where
the number of noise channels equals the number of outputs. When the resulting
idfrd object contains the same output channels as each of the
individual idfrd objects, it cannot accommodate the noise data from
all the idfrd objects.
In case of vertical concatenation, the toolbox concatenates individual noise models
diagonally. The following shows that data.SpectrumData is a block
diagonal matrix of the power spectra and cross spectra of the output noise in the
system:
s in data.s is the abbreviation for the
SpectrumData property name.
Managing idfrd Objects
Subreferencing idfrd Objects
Concatenating idfrd Objects
Operations That Create idfrd Objects
The following operations create idfrd objects:
Constructing
idfrdobjects.Estimating nonparametric models using
etfe,spa, andspafdr. For more information, see Frequency-Response Models.Converting the Control System Toolbox™
frdobject. For more information, see Using Identified Models for Control Design Applications.Converting any linear dynamic system using the
idfrdcommand.For example:
sys_idpoly = idpoly([1 2 1],[0 2],'Ts',1);
G = idfrd(sys_idpoly,linspace(0,pi,128))
G = IDFRD model. Contains Frequency Response Data for 1 output(s) and 1 input(s), and the spectra for disturbances at the outputs. Response data and disturbance spectra are available at 128 frequency points, ranging from 0 rad/s to 3.142 rad/s. Sample time: 1 seconds Status: Created by direct construction or transformation. Not estimated. Model Properties