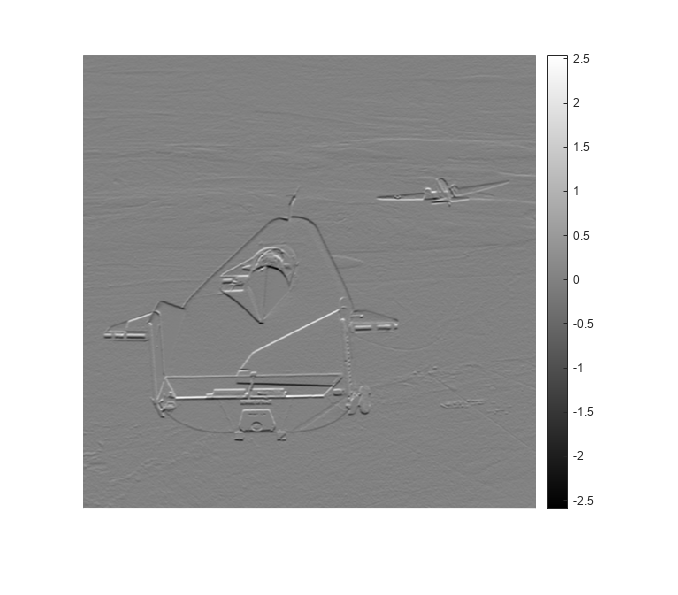
Add Color Bar to Displayed Grayscale Image
This example shows how to display a grayscale image with a color bar that indicates the mapping of data values to colors. Seeing the correspondence between data values and the colors displayed by using a color bar is especially useful if you are displaying unconventional range data as an image.
Read and display a grayscale image.
I = imread('liftingbody.png');Convert the image to data type double. Data is in the range [0, 1].
I = im2double(I);
dataRangeI = [min(I(:)) max(I(:))]
dataRangeI = 1×2

     0     1
Filter the image using an edge detection filter. The filtered data exceeds the default range [0, 1] because the filter is not normalized.
h = [1 2 1; 0 0 0; -1 -2 -1];
J = imfilter(I,h);
dataRangeJ = [min(J(:)) max(J(:))]
dataRangeJ = 1×2

   -2.5961    2.5451
Display the filtered image using the full display range of the filtered data. imshow displays the minimum data value as black and the maximum data value as white.
imshow(J,[])
Use the colorbar function to add the color bar to the image.
colorbar
