Display Different Image Types
If you need help determining what type of image you are working with, see Image Types in the Toolbox.
Display Indexed Images
To display an indexed image using either imshow function or the Image Viewer app, specify both the image matrix
and the colormap. This sample code uses the variable name X to represent
an indexed image in the workspace, and map to represent the
colormap.
imshow(X,map)
or
imageViewer(X,Colormap=map)
For each pixel in X, these functions display the color stored in the
corresponding row of map. If the image matrix data is of data type
double, the value 1 points to the first row in the colormap, the value
2 points to the second row, and so on. However, if the image matrix data is of data type
uint8 or uint16, the value 0 (zero) points to the
first row in the colormap, the value 1 points to the second row, and so on. This offset is
handled automatically by the Image Viewer app and the imshow
function.
If the colormap contains a greater number of colors than the image, the functions ignore
the extra colors in the colormap. If the colormap contains fewer colors than the image
requires, the functions set all image pixels over the limits of the colormap's capacity to
the last color in the colormap. For example, if an image of data type
uint8 contains 256 colors, and you display it with a colormap that
contains only 16 colors, all pixels with a value of 15 or higher are displayed with the last
color in the colormap.
Display Grayscale Images
To display a grayscale image, call the imshow function or open the
Image Viewer app. This documentation uses the variable name I to
represent a grayscale image in the workspace.
Both functions display the image by scaling the intensity values to serve as indices into a grayscale colormap.
If I is double, a pixel value of 0.0 is displayed
as black, a pixel value of 1.0 is displayed as white, and pixel values in between are
displayed as shades of gray. If I is uint8, then a
pixel value of 255 is displayed as white. If I is uint16, then a pixel
value of 65535 is displayed as white.
Grayscale images are similar to indexed images in that each uses an m-by-3 RGB colormap, but you normally do not specify a colormap for a grayscale image. MATLAB® displays grayscale images by using a grayscale system colormap (where R=G=B). By default, the number of levels of gray in the colormap is 256 on systems with 24-bit color, and 64 or 32 on other systems. (See Display Colors for a detailed explanation.)
Display Grayscale Images with Unconventional Ranges
In some cases, the image data you want to display as a grayscale image could have a
display range that is outside the conventional toolbox range (that is, [0, 1] for
single or double arrays, [0, 255] for
uint8 arrays, [0, 65535] for uint16 arrays, or
[-32767, 32768] for int16 arrays). For example, if you filter a
grayscale image, some of the output data could fall outside the range of the original
data.
To display unconventional range data as an image, you can specify the display range
directly, using this syntax for both the imshow function and Image
Tool.
imshow(I,DisplayRange=[low high])
or
imtool(I,DisplayRange=[low high])
If you use an empty matrix ([]) for the display range, these
functions scale the data automatically, setting low and
high to the minimum and maximum values in the array.
The next example filters a grayscale image, creating unconventional range data. The
example calls imtool to display the image using the Image Tool, using
the automatic scaling option. If you execute this example, note the display range
specified in the lower right corner of the Image Tool window.
I = imread("testpat1.png");
J = filter2([1 2;-1 -2],I);
imtool(J,DisplayRange=[]);![Image Viewer app displaying an image of data type double with a nonstandard display range of [-631, 765]](display_imtool_unconventional_datarange.png)
Display Binary Images
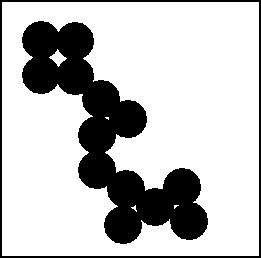
In MATLAB, a binary image is of data type logical. Binary images
contain only 0's and 1's. Pixels with the value 0 are displayed as black; pixels with the
value 1 are displayed as white.
Note
For the toolbox to interpret the image as binary, it must be of data type
logical. Grayscale images that happen to contain only 0's and 1's are
not binary images.
To display a binary image, call the imshow function or open the Image
Viewer app. For example, this code reads a binary image into the MATLAB workspace and then displays the image. The sample code uses the variable name
BW to represent a binary image in the workspace.
BW = imread("circles.png");
imshow(BW)
Change Display Colors of Binary Image
You might prefer to invert binary images when you display them, so that 0 values are displayed as white and 1 values are displayed as black. To do this, use the NOT (~) operator in MATLAB. (In this figure, a box is drawn around the image to show the image boundary.) For example:
imshow(~BW)

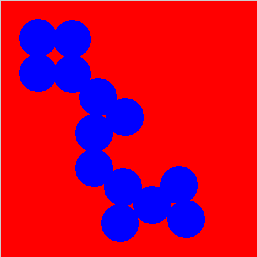
You can also display a binary image using the indexed image colormap syntax. For example, the following command specifies a two-row colormap that displays 0's as red and 1's as blue.
imshow(BW,[1 0 0; 0 0 1])

Display Truecolor Images
Truecolor images, also called RGB images, represent color values directly, rather than
through a colormap. A truecolor image is an
m-by-n-by-3 array. For each pixel
(r,c) in the image, the color is represented by the triplet
(r,c,1:3).
To display a truecolor image, call the imshow function or open the
Image Viewer app. For example, this code reads a truecolor image into the
MATLAB workspace and then displays the image. This sample code uses the variable name
RGB to represent a truecolor image in the workspace.
RGB = imread("peppers.png");
imshow(RGB)
Systems that use 24 bits per screen pixel can display truecolor images directly, because
they allocate 8 bits (256 levels) each to the red, green, and blue color planes. On systems
with fewer colors, imshow displays the image using a combination of color
approximation and dithering. See Display Colors
for more information.
Note
If you display a color image and it appears in black and white, check if the image is an indexed image. With indexed images, you must specify the colormap associated with the image. For more information, see Display Indexed Images.