Label Volume Display Using Point and Line Annotations
This example shows how to add and edit point and line annotations in a Viewer object displaying a 3-D Brain MRI scan.
Label a point with its xyz-coordinates or a custom text label.
Label a line between two points with the distance between the points or a custom text label.
You can use annotation objects to label and measure regions of interest (ROI) in images and volumes you display using imageshow and volshow, respectively. In a 3-D volshow display, you can draw point and line ROIs interactively from the viewer toolbar, or create additional shapes, such as circles, polygons, and freehand shapes, by using the uidraw function. For general information about ROI annotation objects, see Create ROI Shapes.
Load Data
Load a 3-D MRI image volume, vol, and its corresponding labels, labels, into the workspace. The MRI data is a modified subset of the BraTS data set [1].
dataDir = fullfile(toolboxdir("images"),"imdata","BrainMRILabeled");
load(fullfile(dataDir,"images","vol_001.mat"))
load(fullfile(dataDir,"labels","label_001.mat"))
Display Volume with Tumor Label Overlay
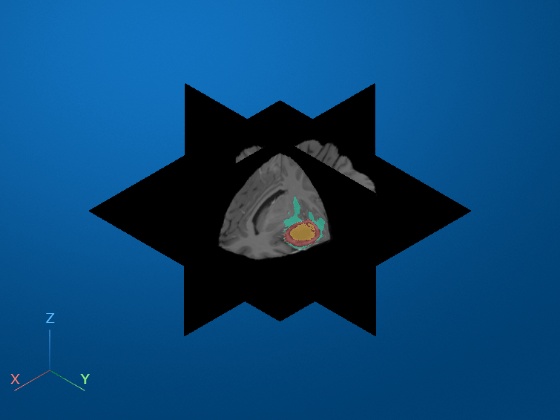
Create a viewer window and display the volume as slice planes with the labels as an overlay. The labels have these classes corresponding to tumor subregions.
The inner non-enhancing region label is yellow. The non-enhancing region is the solid inner core of the tumor.
The outer enhancing region label is red. The enhancing region is the outer rim of the tumor.
The surrounding swelling, or edema, label is cyan.
viewer = viewer3d;

Volume = volshow(vol,Parent=viewer, ...
    RenderingStyle="SlicePlanes", ...
    OverlayData=label, ...
    OverlayAlpha=0.5, ....
    OverlayColormap=turbo, ...
    OverlayDisplayRangeMode="data-range");
Label Tumor Using Point Annotation
Interactively label the non-enhancing tumor region. First, to help place the point accurately, zoom in on the region containing the tumor. Then, in the Viewer toolbar, select the draw annotations icon ![]() , then select the point annotation icon
, then select the point annotation icon ![]() . Click the slice to place the point. By default, the annotation displays the xyz-coordinates of the point. To specify a custom text label, right-click the point and select Edit label. Type the new label text. Click anywhere outside the label to stop editing. You can move the annotation by dragging the point, not the label. This animation shows how to interactively add and edit a point annotation.
. Click the slice to place the point. By default, the annotation displays the xyz-coordinates of the point. To specify a custom text label, right-click the point and select Edit label. Type the new label text. Click anywhere outside the label to stop editing. You can move the annotation by dragging the point, not the label. This animation shows how to interactively add and edit a point annotation.
Alternatively, you can add and edit point annotations programmatically. Programmatic options additionally enable you to specify the color of an annotation.
Create a new viewer and display the volume. To illustrate the effect of individual display parameters, this example creates several viewers. For your own code, to avoid memory errors, limit the number of viewers you create in a given MATLAB® session.
viewer2 = viewer3d;

Volume2 = volshow(vol,Parent=viewer2, ...
    RenderingStyle="SlicePlanes", ...
    OverlayData=label, ...
    OverlayAlpha=0.5, ....
    OverlayColormap=turbo, ...
    OverlayDisplayRangeMode="data-range");
Create three point annotation objects to label the tumor subregions. Use name-value arguments to specify the label, position, and color for each point. The Position name-value argument specifies the xyz-coordinates of the point in world coordinates.
point1 = images.ui.graphics3d.roi.Point(label="Non-Enhancing", ...
    Position=[129.7 161.1 77.1],Color="yellow");
point2 = images.ui.graphics3d.roi.Point(label="Edema", ...
    Position=[119.8 140.8 88.6],Color="cyan");
point3 = images.ui.graphics3d.roi.Point(label="Enhancing", ...
    Position=[119.8 159.2 83.4],Color="red");
Add the point annotations to the viewer by updating the Annotations property of the Viewer object.
viewer2.Annotations = [point1 point2 point3];
Zoom in to focus on the tumor region.
viewer2.CameraZoom = 3;

Measure Tumor Size Using Line Annotation
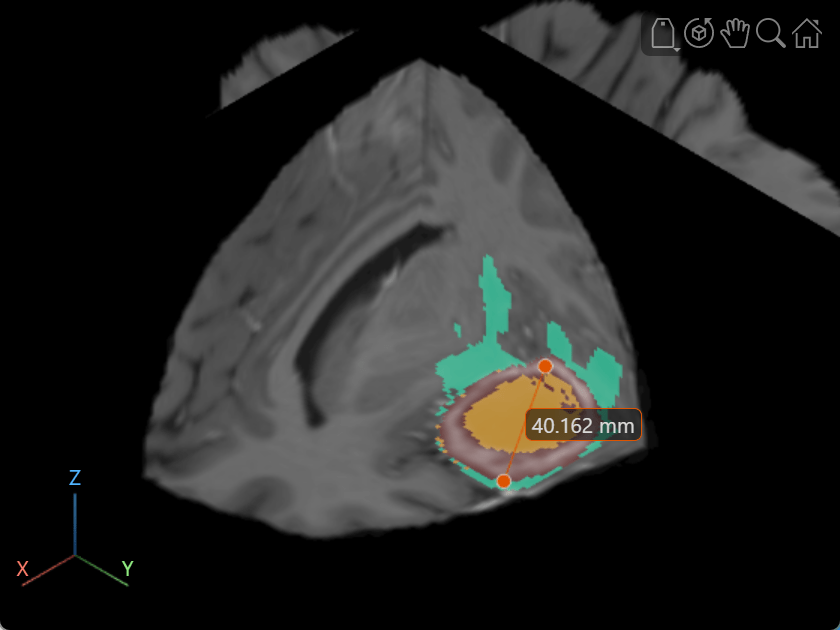
Interactively measure the tumor size in the current transverse slice. Rotate the volume to view the transverse plane by clicking the Z axis indicator in the lower-left corner of the viewer. To facilitate accurate measurement, zoom in on the region containing the tumor. Then, in the Viewer toolbar, select the draw annotations icon ![]() , then select the line icon
, then select the line icon ![]() . Click and hold the slice to place the first endpoint, drag to draw the line, and release to place the second endpoint. The line annotation displays the length of the line, with the specified unit label. To reposition one endpoint, drag the endpoint, not the line or the label. To move the whole line, including both endpoints, hold Ctrl and drag one of the endpoints. This animation shows how to draw a line interactively.
. Click and hold the slice to place the first endpoint, drag to draw the line, and release to place the second endpoint. The line annotation displays the length of the line, with the specified unit label. To reposition one endpoint, drag the endpoint, not the line or the label. To move the whole line, including both endpoints, hold Ctrl and drag one of the endpoints. This animation shows how to draw a line interactively.
Alternatively, you can add the measurement line programmatically. In a new viewer window, display the brain MRI as 2-D slices with the tumor label overlay.
viewer3 = viewer3d;

Volume3 = volshow(vol,Parent=viewer3, ...
    RenderingStyle="SlicePlanes", ...
    OverlayData=label, ...
    OverlayAlpha=0.5, ....
    OverlayColormap=turbo, ...
    OverlayDisplayRangeMode="data-range");
By default, the viewer displays measurements in voxel units with no label. To display a units label, specify the SpatialUnits property of the Viewer object. For this example, the MRI scan has voxel spacing of 1-by-1-by-1 mm. Specify the units as "mm".
viewer3.SpatialUnits = "mm";Create a Line object, using name-value arguments to specify the positions of the endpoints.
measurementLine = images.ui.graphics3d.roi.Line(Position=[114.4 149.4 77.0; 148.0 171.4 77.0]);
Add the annotation to the viewer by updating the Annotations property of the Viewer object.
viewer3.Annotations = measurementLine;
Zoom in to focus on the tumor region.
viewer3.CameraZoom = 3;
References
[1] Medical Segmentation Decathlon. "Brain Tumours." Tasks. Accessed May 10, 2018. http://medicaldecathlon.com/. The BraTS data set is provided by Medical Segmentation Decathlon under the CC-BY-SA 4.0 license. All warranties and representations are disclaimed. See the license for details. MathWorks® has modified the subset of data used in this example. This example uses the MRI data of one scan from the original data set, saved to a MAT file.
See Also
viewer3d | volshow | uidraw | Point | Line