主要内容

showEncircledEnergy

R2026b

Plot encircled energy of point spread function

Since R2026b

Description

Add-On Required: This feature requires the Optical Design and Simulation Library for Image Processing Toolbox add-on.

hEE = showEncircledEnergy(psfr) plots encircled energy as a function of radius for the point spread function (PSF) results in psfr. The function returns an EncircledEnergyChart object.

example

hEE = showEncircledEnergy(psfr,Name=Value) specifies chart display options using one or more name-value arguments. For example, specify Grid="major" to show major grid lines.

example

Examples

collapse all

Load the sample Double Gauss lens system using zmximport. Define a field point at an angle of 4 degrees along the x-axis, specify a wavelength of 587.56 nm, and calculate the geometric PSF.

opsys = zmximport("DoubleGaussLens.zmx");
fp = fieldPoint(Angles=[4 0]);
lambda = 587.56;
psfr = psf(opsys, FieldPoints=fp, Wavelengths=lambda, Method="Geometric");

Visualize the fraction of total energy enclosed within a given radius using the showEncircledEnergy function.

hEE = showEncircledEnergy(psfr);
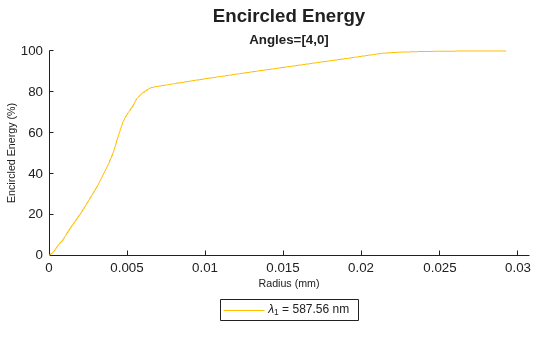
Figure contains an object of type optics.chart.encircledenergychart. The chart of type optics.chart.encircledenergychart has title Encircled Energy.

Load the sample Double Gauss lens system using zmximport. Define a field point at an angle of 4 degrees along the x-axis and specify an array of three wavelengths (486.13 nm, 587.56 nm, and 656.28 nm).

opsys = zmximport("DoubleGaussLens.zmx");
fp = fieldPoint(Angles=[4 0]);
lambdas = [486.13 587.56 656.28];

Compute the Huygens PSF across all specified wavelengths. Use the showEncircledEnergy function to plot the energy curves for only the first and third wavelengths, add a major grid, and specify a custom title. Turn off the plot legend by modifying the Legend property of the returned chart object.

psfr = psf(opsys, FieldPoints=fp, Wavelengths=lambdas, Method="Huygens");
hEE = showEncircledEnergy(psfr, WavelengthIndices=[1 3], Grid="major", ...
    Title="Encircled Energy");
hEE.Legend = "off";
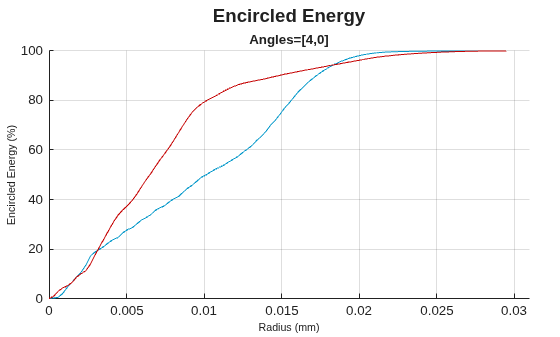
Figure contains an object of type optics.chart.encircledenergychart. The chart of type optics.chart.encircledenergychart has title Encircled Energy.

Input Arguments

collapse all

Point spread function results, specified as a GeometricPSF object, a HuygensPSF object, or an array of PSF result objects. Create these objects by using the psf object function.

When you specify an array of PSF result objects, the chart displays one tile for each PSF object.

Name-Value Arguments

collapse all

Specify optional pairs of arguments as Name1=Value1,...,NameN=ValueN, where Name is the argument name and Value is the corresponding value. Name-value arguments must appear after other arguments, but the order of the pairs does not matter.

Example: showEncircledEnergy(psfr,Grid="major",WavelengthIndices=[1 3]) shows major grid lines and plots encircled energy for the first and third wavelengths.

Chart title, specified as a string scalar or character vector.

Wavelength indices to plot, specified as a vector of positive integers. By default, the chart plots all wavelengths in psfr.

Data Types: double

Line colors, specified as a color name, an RGB triplet, a string vector of color names, or a numeric matrix of RGB triplets. By default, line colors are computed from the wavelengths in psfr.

Option to show the legend, specified as "on", "off", a numeric or logical 1 (true), or a numeric or logical 0 (false).

Grid display option, specified as "off", "major", or "minor".

Parent container, specified as a figure, panel, tab, grid layout, or tiled chart layout. By default, the chart appears in a new figure.

Output Arguments

collapse all

Encircled energy chart, returned as an EncircledEnergyChart object. Use hEE to inspect or modify chart properties such as Title, Legend, Grid, WavelengthIndices, and Color.

Version History

Introduced in R2026b