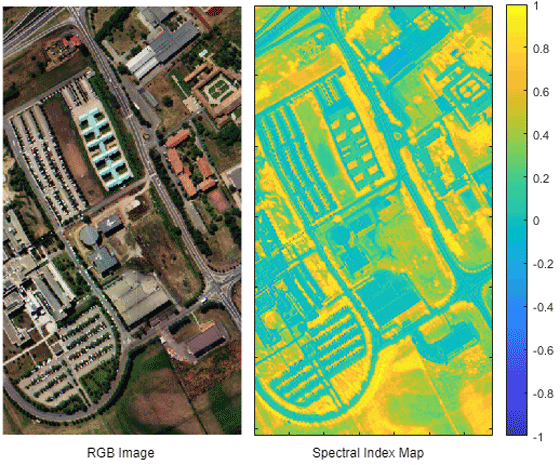
Spectral Indices
Spectral index is the ratio of broadband spectral bands or as the normalized differences between two bands.
There are various sensors to capture hyperspectral and multispectral data whose band centers are usually slightly different. Thus defining bands gives you the freedom to apply spectral indices to a wide range of sensors. The Band Definition section provides details of band definitions used in the Hyperspectral Imaging Library for Image Processing Toolbox™.
Spectral indices characterize the specific features of interest of a target by exploiting its biophysical and chemical properties. These features of interest enable you to identify plant, water, soil, and various forms of built-up regions such as road, house, railway track, and parking lot. For more information on supported spectral indices, see List of Supported Spectral Indices section.
Band Definition
Hyperspectral Imaging Library for Image Processing Toolbox uses various band definitions to compute spectral indices. The toolbox selects the nearest wavelength to the center of each band available in input hyperspectral or multispectral data.
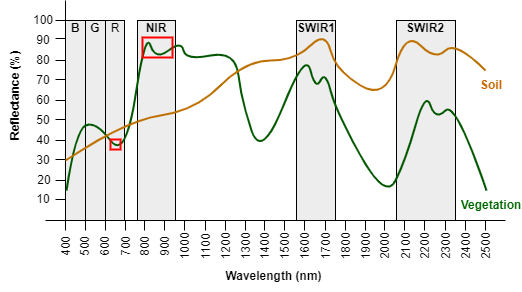
Depending on the range of the wavelengths for a band, the band definition can be of two types.
Broadband — Bands generally have wider wavelength ranges.
Narrowband — Bands generally have narrow wavelength ranges.
This table lists the broadband definitions used in the toolbox.
| Band | Minimum | Center | Maximum |
| B | 400 nm | 470 nm | 500 nm |
| G | 500 nm | 550 nm | 600 nm |
| R | 600 nm | 650 nm | 700 nm |
| NIR | 760 nm | 860 nm | 960 nm |
| SWIR1 | 1550 nm | 1650 nm | 1750 nm |
| SWIR2 | 2080 nm | 2220 nm | 2350 nm |
This table lists the narrowband definitions used in the toolbox.
| Band | Minimum | Center | Maximum |
| 525 nm | 531 nm | 550 nm | |
| 540 nm | 550 nm | 560 nm | |
| 560 nm | 570 nm | 575 nm | |
| 650 nm | 670 nm | 690 nm | |
| 680 nm | 700 nm | 730 nm | |
| 720 nm | 795 nm | 800 nm | |
| 780 nm | 800 nm | 865 nm | |
| 815 nm | 819 nm | 824 nm | |
| 830 nm | 990 nm | 995 nm | |
| 1500 nm | 1510 nm | 1515 nm | |
| 1590 nm | 1599 nm | 1620 nm | |
| 1670 nm | 1680 nm | 1690 nm | |
| 1980 nm | 2000 nm | 2040 nm | |
| 2085 nm | 2100 nm | 2110 nm | |
| 2170 nm | 2200 nm | 2220 nm |
List of Supported Spectral Indices
Hyperspectral Imaging Library for Image Processing
Toolbox supports various spectral indices used to identify vegetation,
minerals, burned areas, and built up regions. This table lists the spectral indices
supported by the spectralIndices function. The equations of these indices use the
band definitions as specified in Band Definition. You can
compute the indices CMR, EVI, GVI, MNDWI, NBR, NDBI, NDVI, OSAVI, and SR, which use
broadband band definitions, for both narrowband hyperspectral images and broadband
multispectral images. You can compute the indices CAI, MCARI, MTVI, MSI, NDMI, NDNI,
and PRI, which use narrowband band definitions, for only narrowband hyperspectral
images.
| Index Name | Equation | Description |
| Cellulose absorption index (CAI) | CAI identifies dried plant materials relative to the cellulose sensitive wavelengths in the range 2000 nm to 2200 nm. Use this index to monitor crop residue, plant health, and fuel conditions in an ecosystem. The index value below -1 represents soil whereas the index value above -1 represents crop residue. | |
| Clay minerals ratio (CMR) | CMR identifies hydrothermally altered rocks containing clay and alunite. Use this index to map minerals in rock surfaces. | |
| Enhanced vegetation index (EVI) | EVI identifies vegetation regions with a high leaf area index. It uses blue reflectance to correct the soil background by including atmospheric influences. For vegetation pixels, the index value varies in the range (0, 1). | |
| Green vegetation index (GVI) | GVI identifies green vegetation by reducing the background soil effect. | |
| Modified chlorophyll absorption ratio index (MCARI) | MCARI identifies the vegetation regions that contain chlorophyll by minimizing the combined effects of soil and non-photosynthetic surfaces. | |
| Modified triangular vegetation index (MTVI) | MTVI identifies vegetation regions. This index includes the 800 nm wavelength, which is influenced by changes in leaf and canopy structure. | |
| Modified normalized difference water index (MNDWI) | MNDWI identifies open water surfaces, reducing background noise from soil, vegetation, and built-up areas. The index value varies in the range (-1, 1). | |
| Moisture stress index (MSI) | MSI maps the level of leaf water content in vegetation canopies. | |
| Normalized burn ratio (NBR) | NBR identifies burned areas in larger fire zones. You can obtain a burn sensitive image by subtracting the pre-fire and post-fire NBR images. The index value varies in the range (-1, 1). | |
| Normalized difference built-up index (NDBI) | NDBI identifies urban areas with high reflectance in the SWIR region as compared to the NIR region. The index value varies in the range (-1, 1). | |
| Normalized difference mud index (NDMI) | NDMI identifies shallow water or muddy surfaces. The index value varies in the range (-1, 1). | |
| Normalized difference nitrogen index (NDNI) | NDNI maps the amount of nitrogen content in vegetation canopies. Because NDNI is a logarithmic index, use data values in the range 0 to 1 for accurate results. | |
| Normalized difference vegetation index (NDVI) | NDVI identifies vegetation canopies. The index value varies in the range (-1, 1). A value close to 1 indicates healthy vegetation, 0 indicates unhealthy vegetation, and -1 indicates no vegetation. | |
| Optimized soil adjusted vegetation index (OSAVI) | OSAVI identifies sparse vegetation, where soil is visible through the canopy. | |
| Photochemical reflectance index (PRI) | PRI maps the photosynthetic efficiency of a region by detecting the changes in carotenoid pigments in live foliage. The index value varies in the range (-1, 1). | |
| Simple ratio (SR) | SR finds the ratio of vegetation and chlorophyll absorption wavelength features. |
References
[1] Bannari, A., D. Morin, F. Bonn, and A. R. Huete. “A Review of Vegetation Indices.” Remote Sensing Reviews 13, no. 1–2 (August 1995): 95–120. https://doi.org/10.1080/02757259509532298.
[2] Xue, Jinru, and Baofeng Su. “Significant Remote Sensing Vegetation Indices: A Review of Developments and Applications.” Journal of Sensors 2017 (2017): 1–17. https://doi.org/10.1155/2017/1353691.
[3] Haboudane, D. “Hyperspectral Vegetation Indices and Novel Algorithms for Predicting Green LAI of Crop Canopies: Modeling and Validation in the Context of Precision Agriculture.” Remote Sensing of Environment 90, no. 3 (April 15, 2004): 337–52. https://doi.org/10.1016/j.rse.2003.12.013.
[4] Thenkabail, Prasad S., John G. Lyon, and Alfredo Huete, eds. Hyperspectral Indices and Image Classifications for Agriculture and Vegetation. Boca Raton: CRC Press, 2018.