Oscilloscope Explorer
R2026bDescription
The Oscilloscope Explorer app provides a user interface to connect to and communicate with oscilloscopes.
This app is supported only on Windows and communicates with oscilloscopes through IVI-compliant drivers. You must have the Instrument Control Toolbox™ Support Package for IVI® and VXIplug&play Drivers. For more information, see Install Instrument Control Toolbox Support Package for IVI and VXIplug&play Drivers.
Note
If you have NI™ instrument software installed but are not using NI oscilloscopes, you can speed up app startup by disabling the NI device scan.
To disable the scan, enter
oscilloscopeExplorer.preferences.detectNIDevices("off") at the command
line before opening the app. This setting persists across sessions.
To force a fresh NI device scan, use
oscilloscopeExplorer.preferences.clearNIPreference.
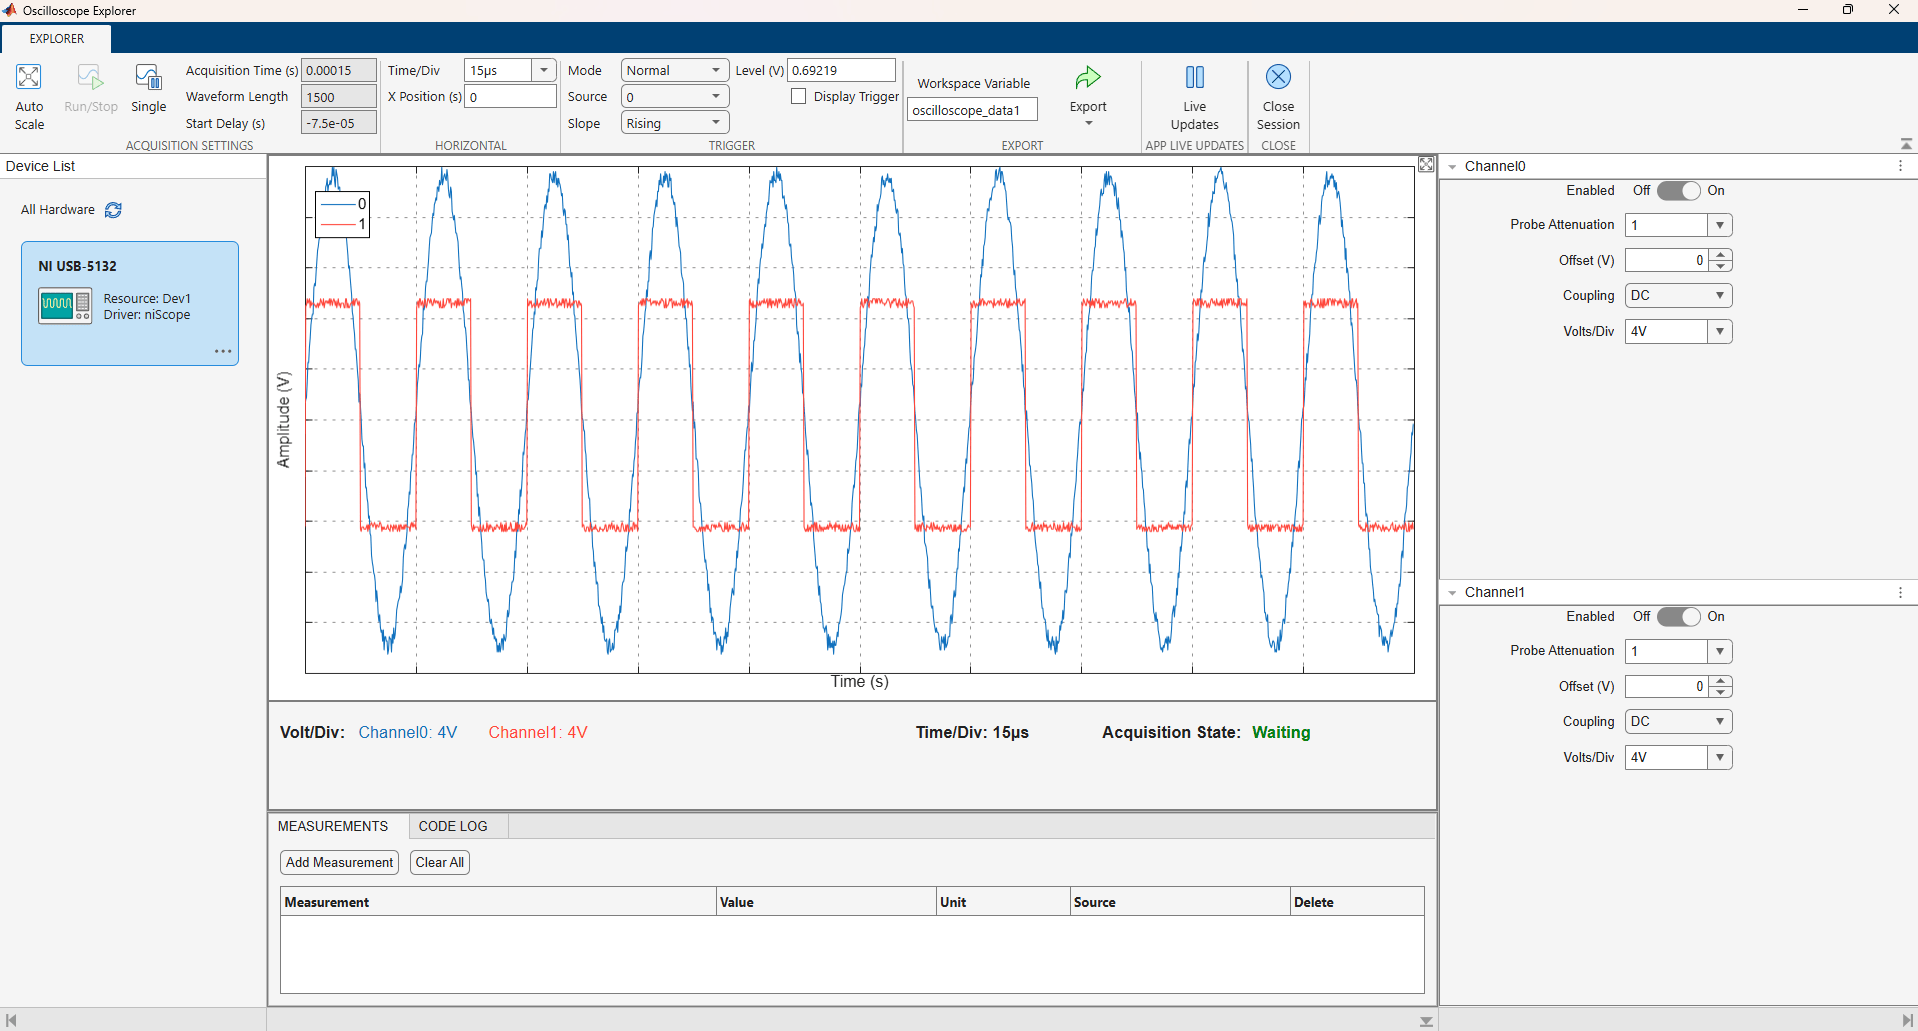
Open the Oscilloscope Explorer App
MATLAB® Toolstrip: On the Apps tab, under Test and Measurement, click Oscilloscope Explorer
 .
.MATLAB command prompt: Enter
oscilloscopeExplorer.
Examples
Connect to a Tektronix® TBS1072C oscilloscope, adjust the time and voltage scales to visualize a waveform, and export the acquired data to the MATLAB workspace.
Open the app. The app displays a card for each connected device that it can recognize. The device card might indicate Configuration Needed.
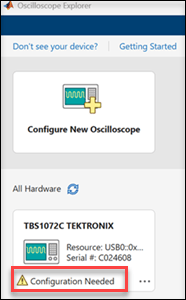
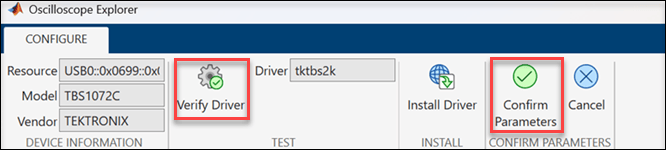
Click the device card to open the Configure tab. Verify the Resource, Model, and Vendor parameters auto-populated in the Device Information section. To check whether the required driver is installed, click Verify Driver. If the required driver is available in your system, the app populates the Driver parameter. To connect and begin the session, click Confirm Parameters.
If the driver is not installed, you can install the driver using the Install Driver option. For more information, see Install Driver from IVI Foundation.
After a successful connection, the app switches to the Explorer tab and displays the live waveform. The waveform plot shows data for enabled channels.
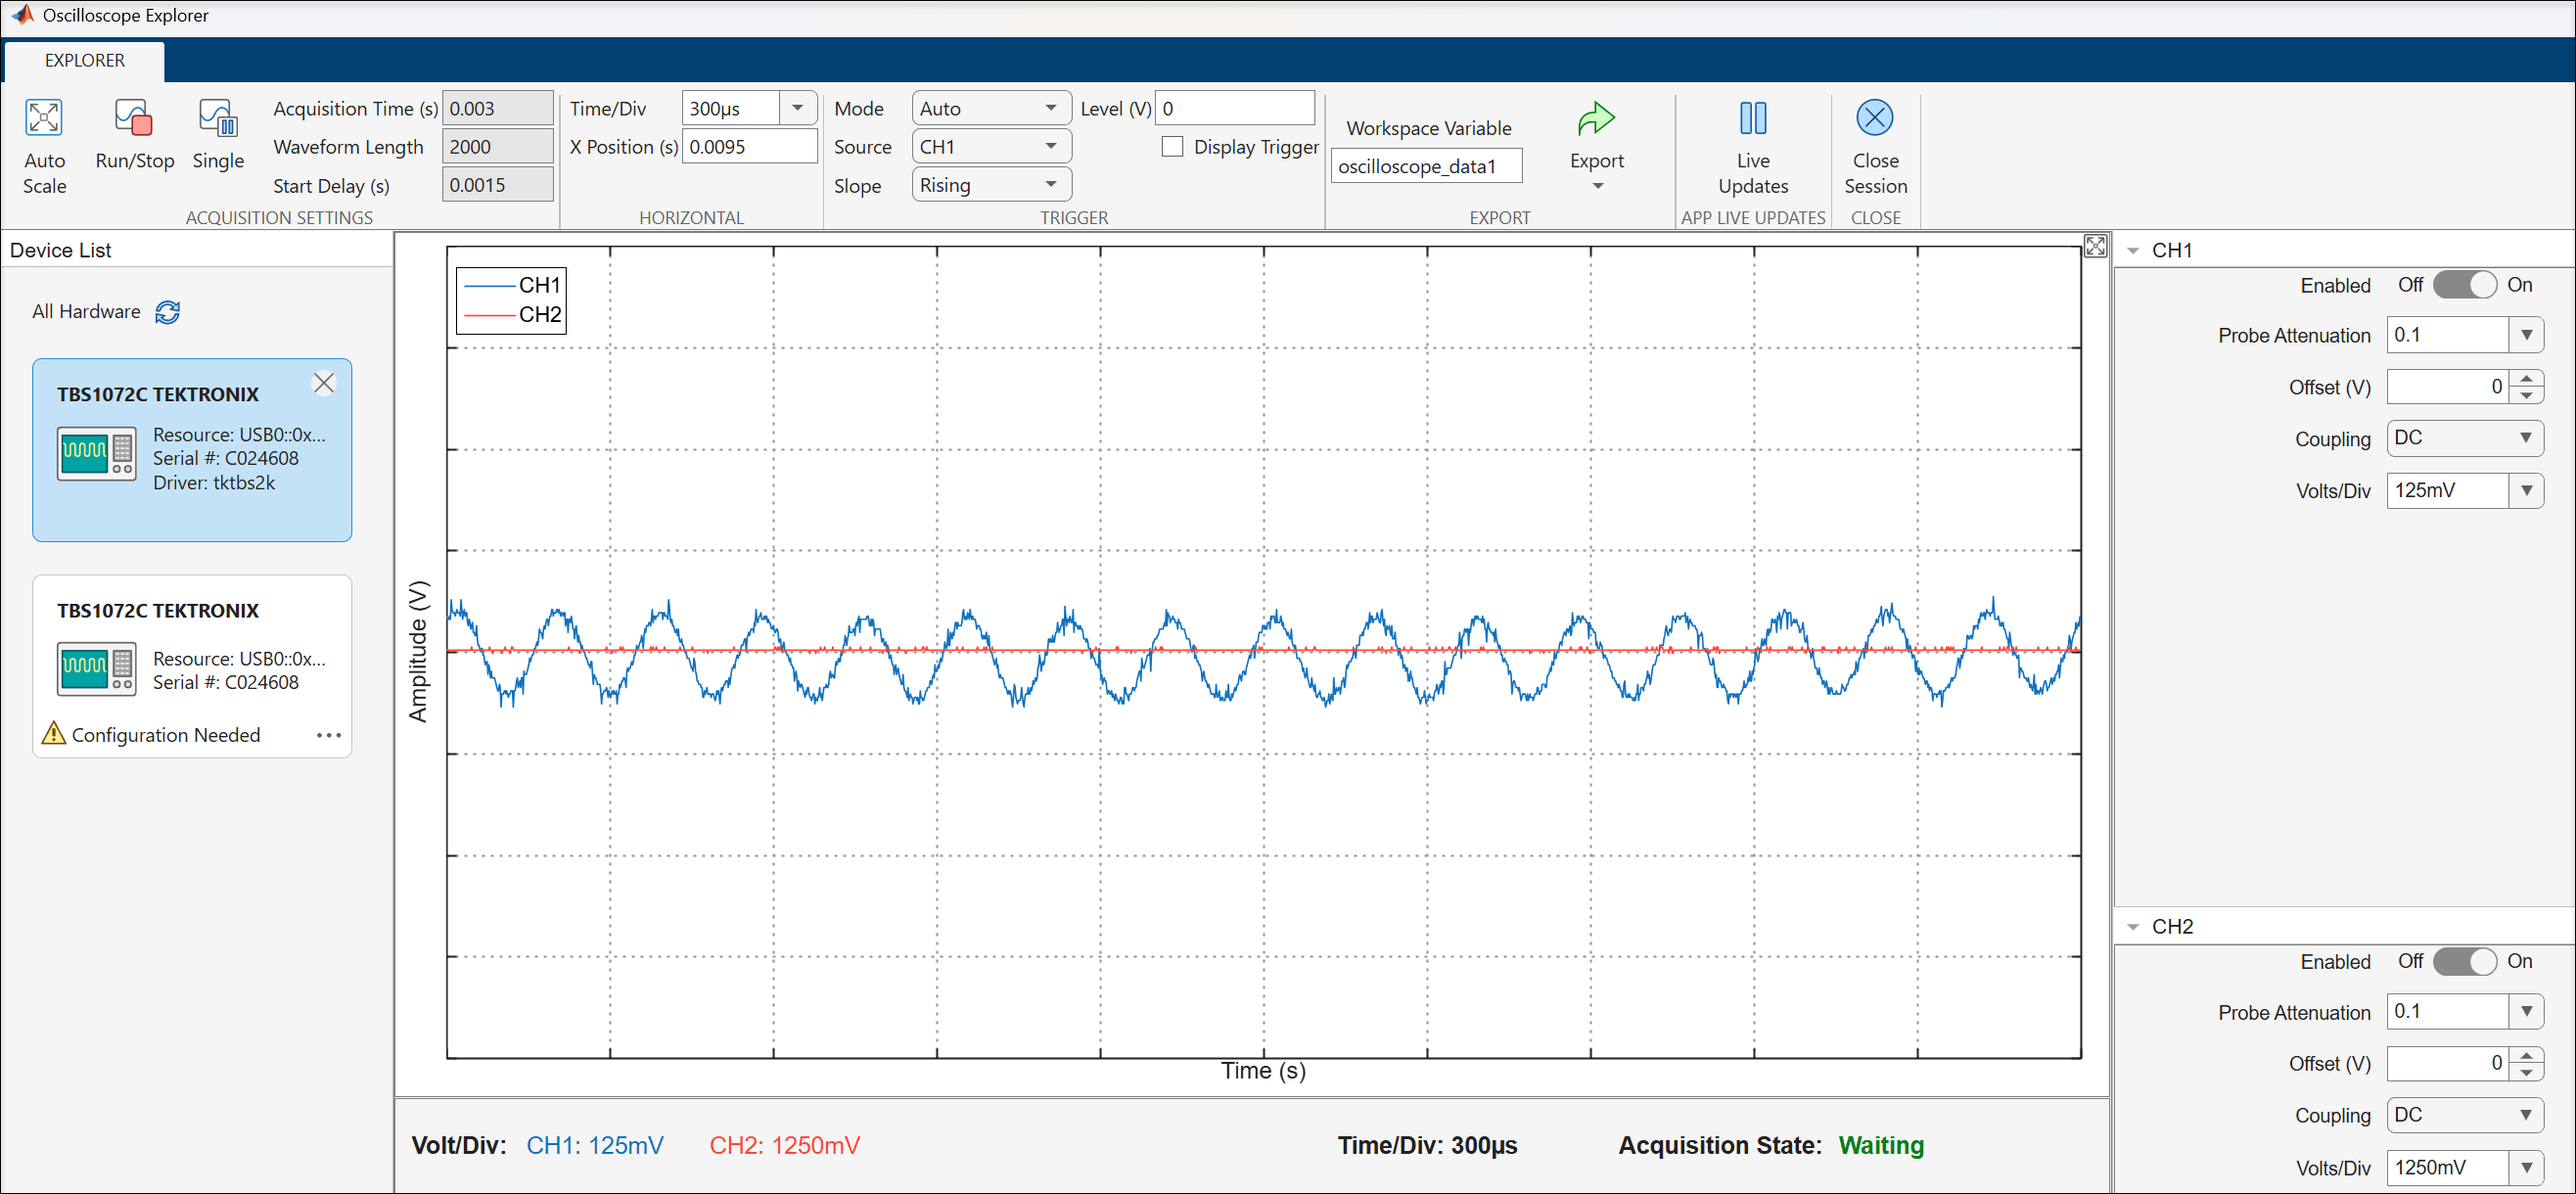
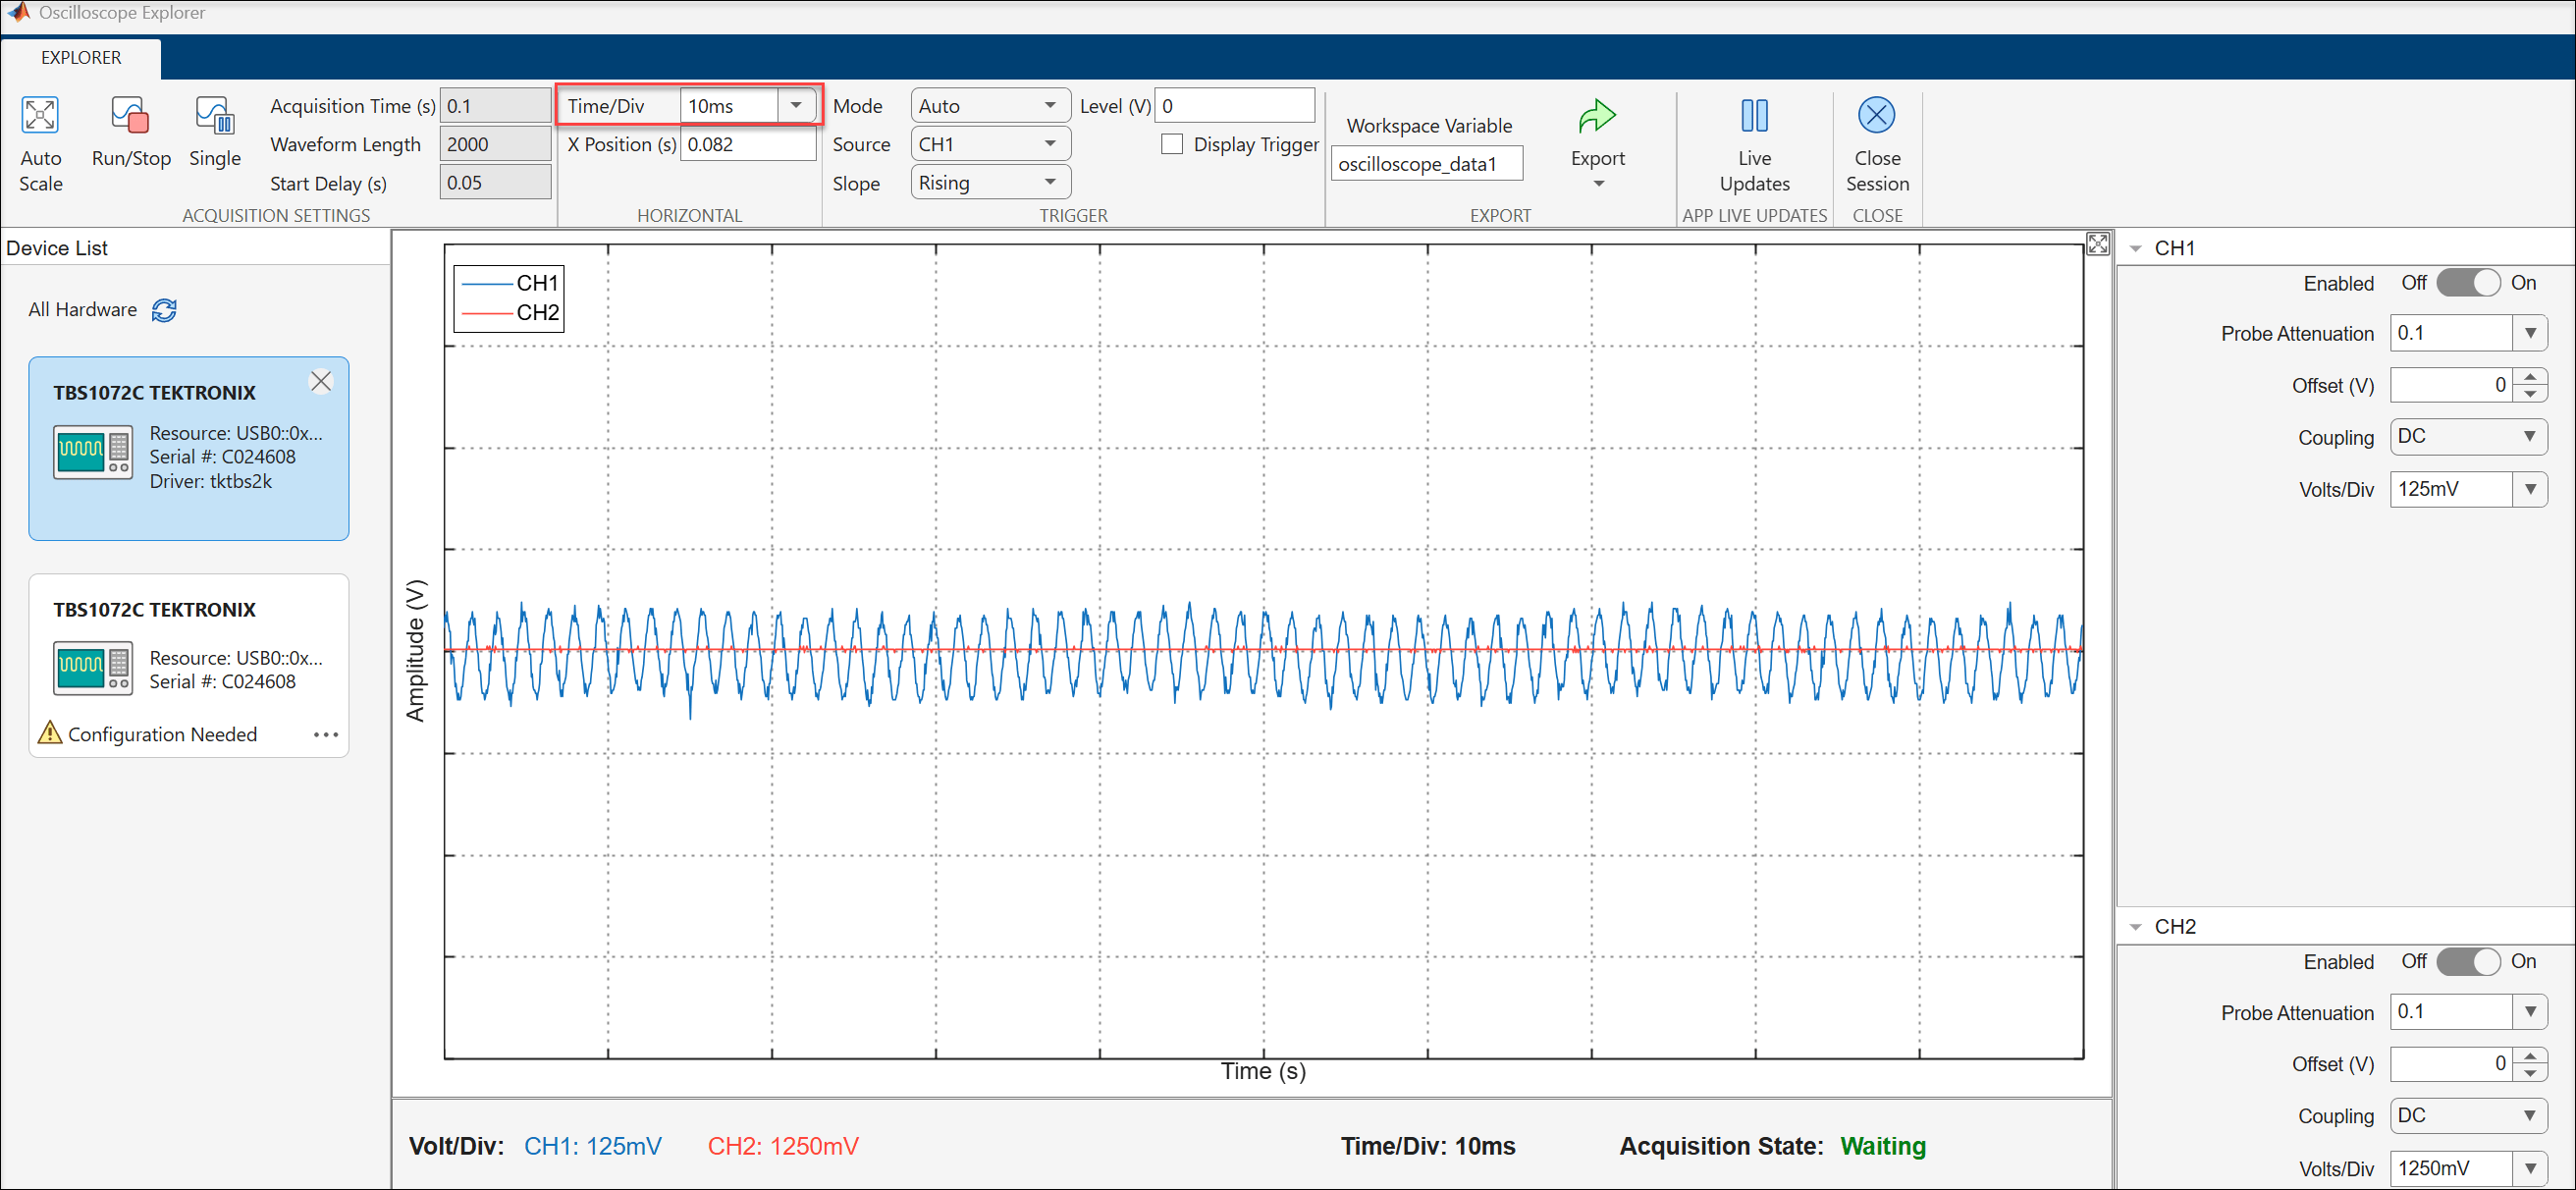
To display more signal cycles, change Time/Div to
10ms in the Horizontal section of the
toolstrip.
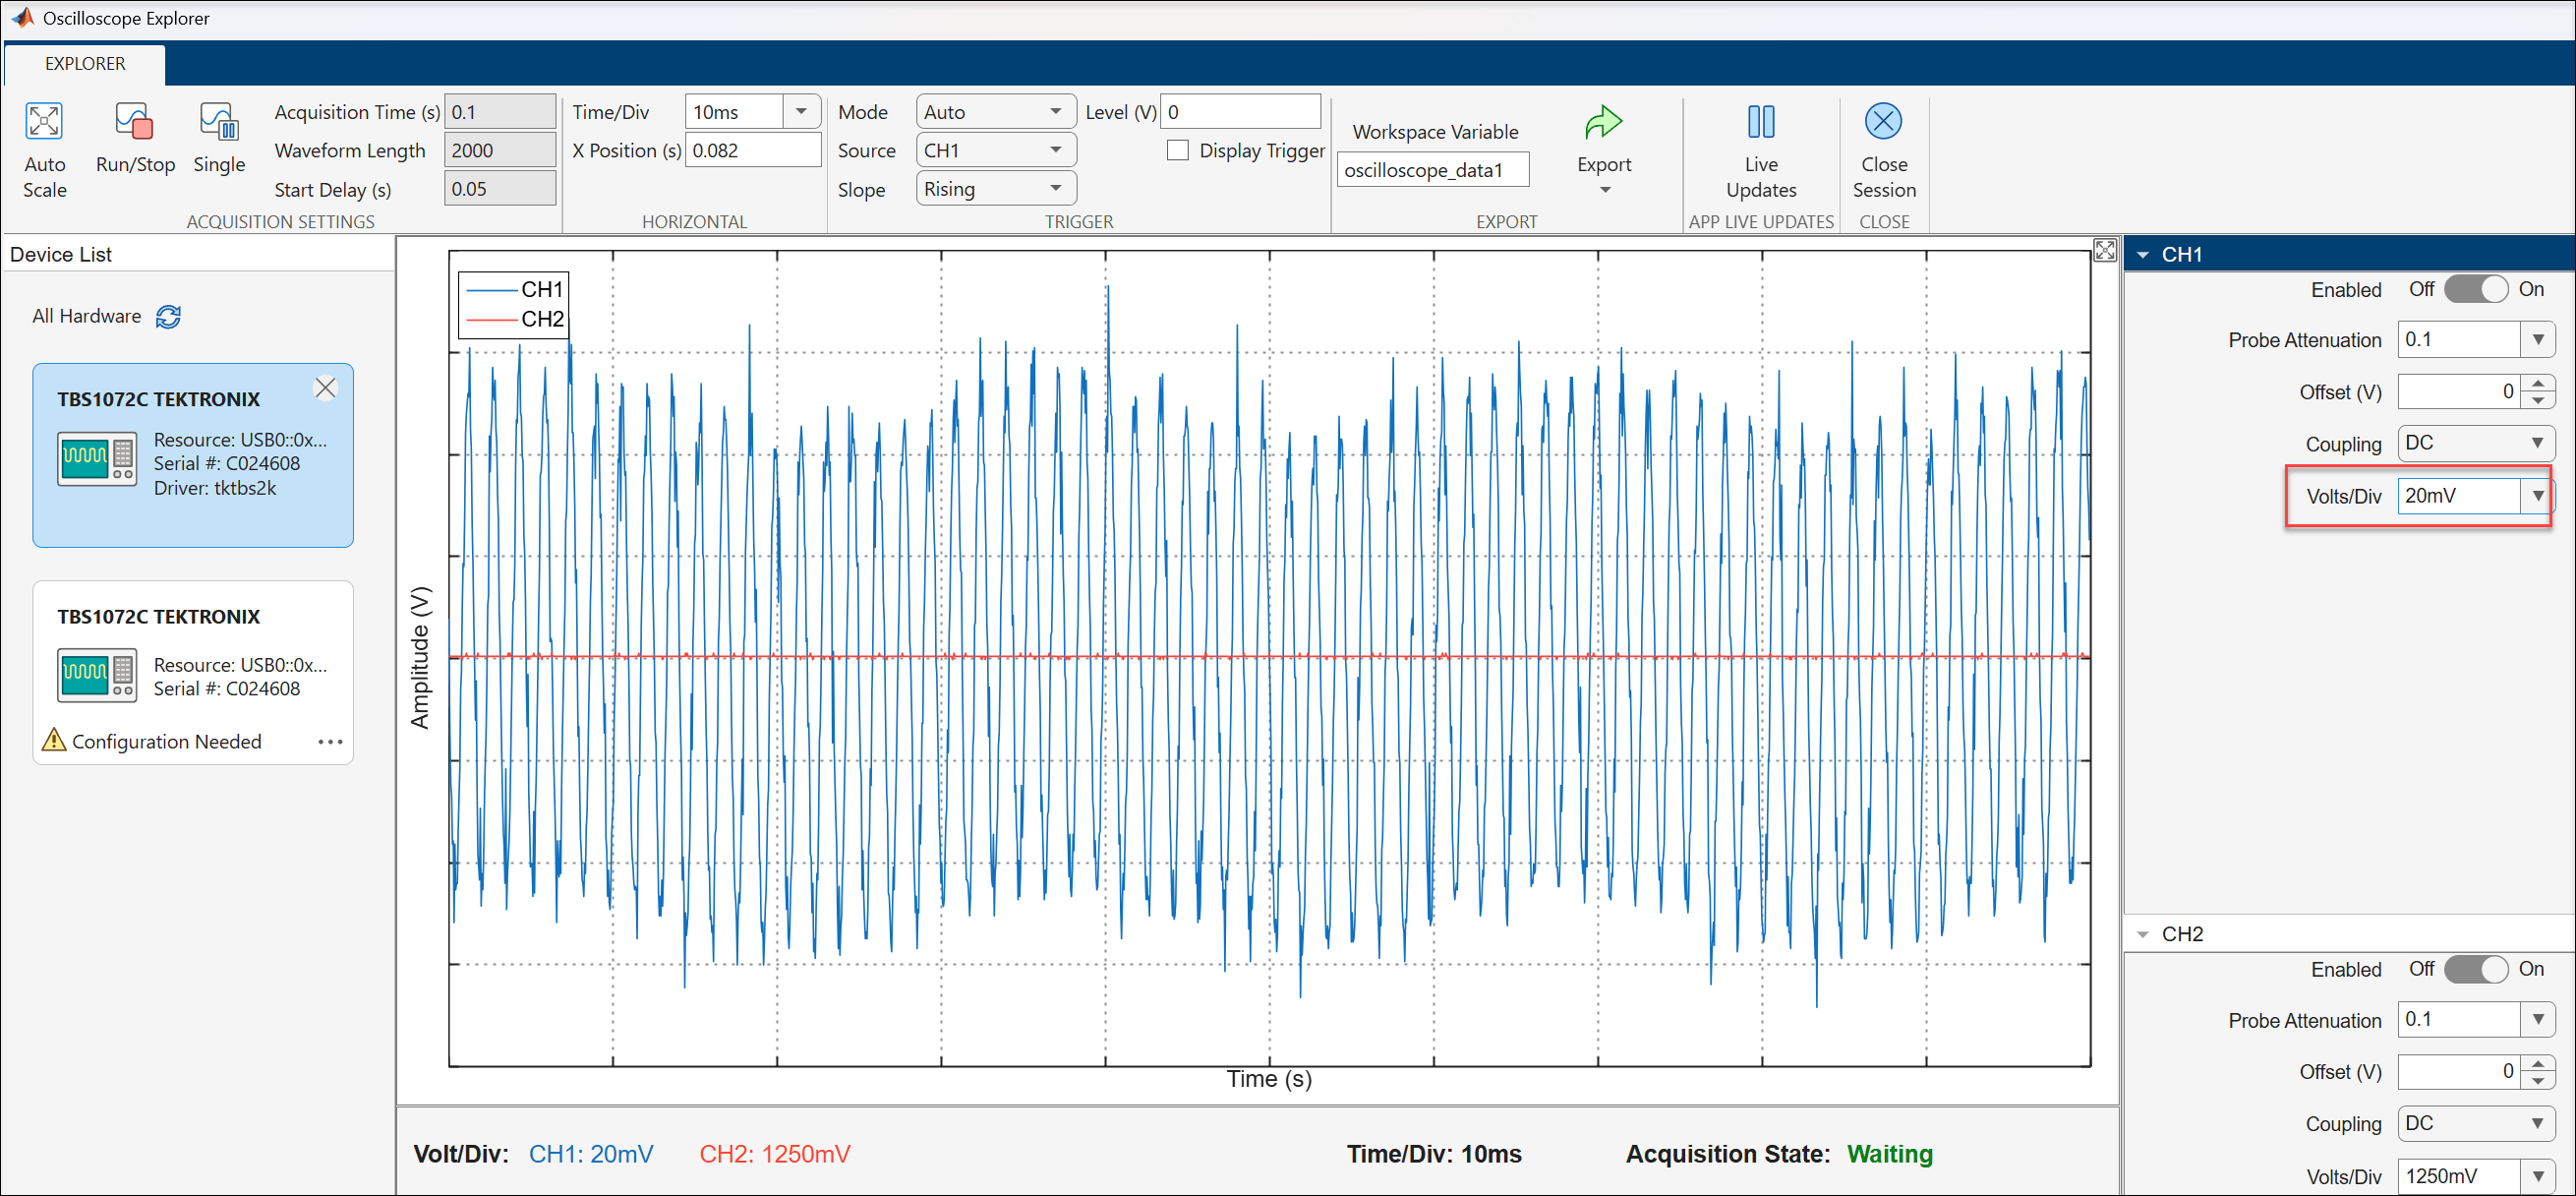
To zoom in on the signal amplitude, change Volts/Div to
20mV in the CH1 panel.
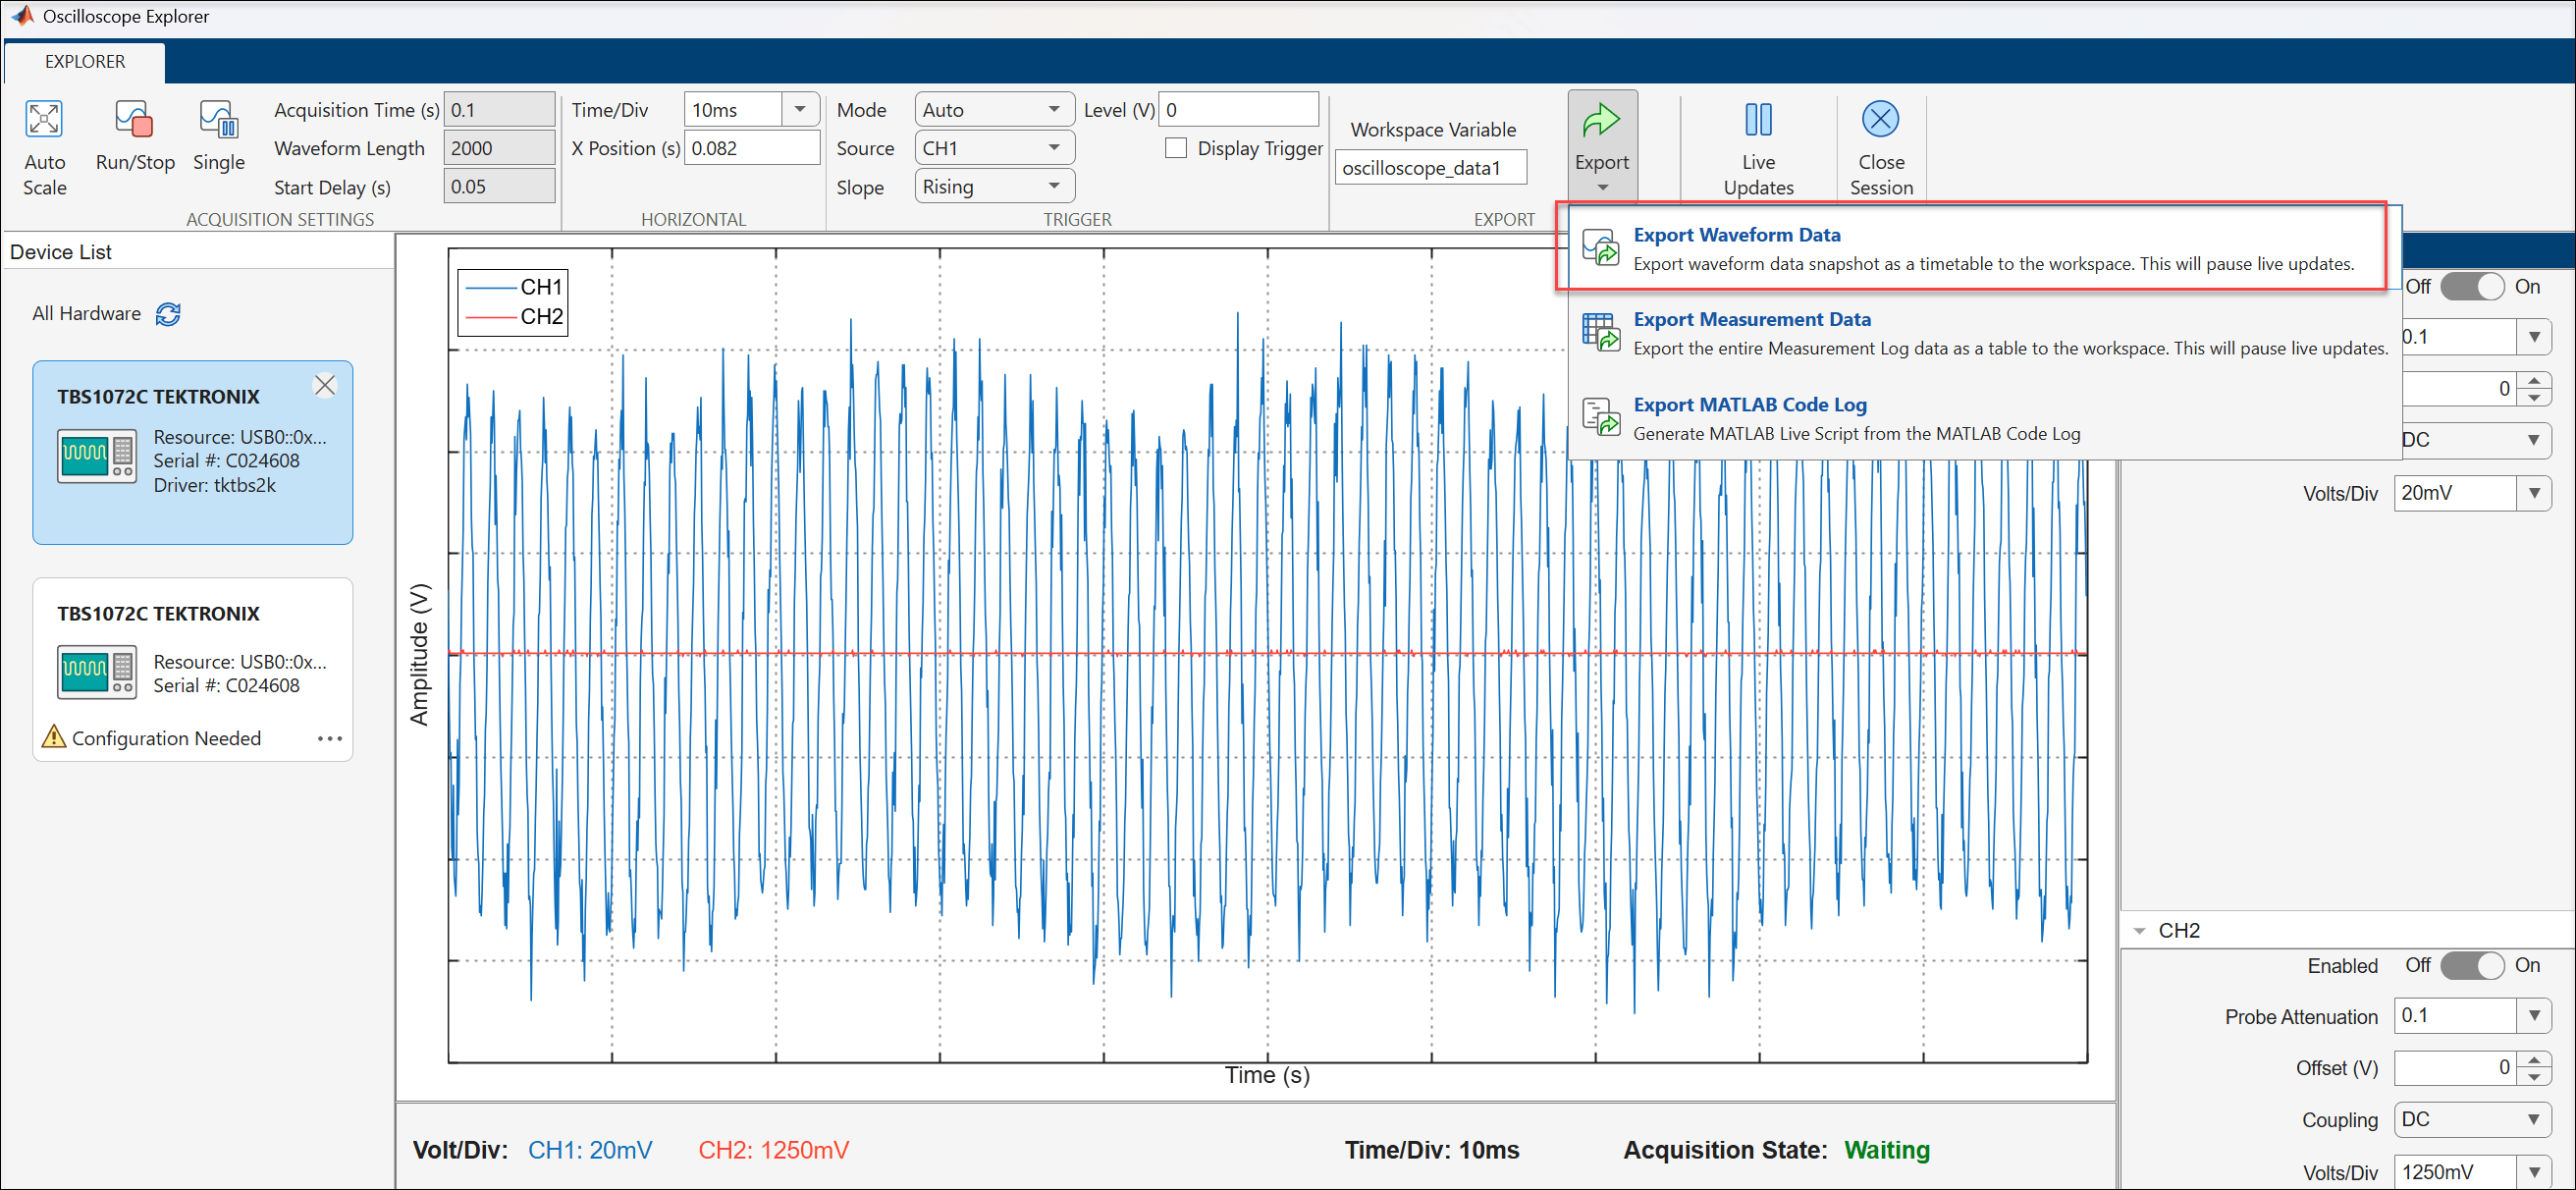
To export the acquired waveform data to the workspace, click
Export and select Export Waveform
Data .
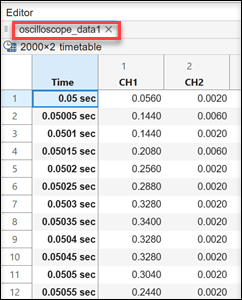
The exported data appears in the workspace as a timetable with
columns for Time, CH1, and CH2.
Channel column names vary based on the connected oscilloscope.
Related Examples
Parameters
Configure Tab

The sections of the Configure tab provide the means to install a driver for your oscilloscope and to make a connection to the device. For instructions on installing and testing a driver, and confirming a connection, see Configure Driver in Oscilloscope Explorer App.
Explorer Tab
The Explorer tab provides controls for the oscilloscope settings, operations, functions, and results. This includes time and amplitude scaling, measurement results, and code logs. Not all functionality is available in all supported models.
Acquisition Settings Section
Click Auto Scale to automatically adjust the time and voltage scales for all enabled channels to fit the signal on the waveform plot.
Click Run/Stop to toggle continuous waveform acquisition. When running, the oscilloscope continuously acquires and displays waveform data.
Click Single to perform a single waveform acquisition and then stop.
This parameter is read-only.
Displays the total time duration of the waveform acquisition in seconds.
This parameter is read-only.
Displays the number of data points in the acquired waveform.
This parameter is read-only.
Displays the delay in seconds before the acquisition begins.
Horizontal Section
Specify the time per division for the horizontal axis of the waveform display. You
can choose from the predefined values or enter a custom value. For example, to
accommodate 250 microseconds per division, enter 250us. Decreasing
this value zooms in on a shorter time window. Increasing the value shows more signal
cycles.
Specify the horizontal position offset in seconds to shift the waveform display left or right.
Trigger Section
Select the trigger mode for waveform acquisition.
Auto— Oscilloscope triggers automatically if no trigger event occursNormal— Oscilloscope waits for a valid trigger event before acquiring data
Select the channel to use as the trigger source. The drop-down list shows the available channels in the connected oscilloscope.
Select the edge slope for the trigger event.
Specify the voltage level at which the trigger event occurs.
Select this check box to display the trigger level as a horizontal line on the waveform plot.
Export Section
Edit the name of the workspace variable to which you want to export data. The export options save data to the workspace using this variable name.
Choose one of the following options for exporting data from this app:
Export Waveform Data— Save the waveform data as atimetableto the workspace. This option pauses live updates during export.Export Measurement Data— Save the Measurements table as atableto the workspace.Export MATLAB Code Log— Generate a MATLAB live script from the Code Log content.
Session Section
Click Live Updates to toggle live waveform acquisition and display. When this option is enabled, the waveform plot updates continuously with new data from the oscilloscope.
Click Close Session to disconnect from the oscilloscope and return to the app home page.
Channel Panels (CH1, CH2)
Toggle the channel display on or off. When this option is enabled, the channel waveform data is acquired and displayed on the plot.
Specify the probe attenuation ratio for the channel. You can choose from the predefined values or enter a positive scalar. The value corresponds to the attenuation factor of the probe connected to the oscilloscope.
Specify the vertical offset in volts to shift the channel waveform up or down on the display.
Select the input coupling mode for the channel.
DC— Allows both AC and DC components of the signalAC— Blocks the DC component and allows only the AC component
Specify the voltage per division for the vertical axis of the channel. You can choose from the predefined values or enter a positive scalar. Decreasing this value zooms in on the signal amplitude. Increasing the value shows a wider voltage range.
Measurements Panel
Click Add Measurement to open a dialog where you select a
measurement type and source channel, then add the measurement to the
Measurements table. Available measurement types are
Amplitude, Period,
Peak to Peak, Frequency,
Average, Maximum,
Minimum, RMS,
Positive Width, Negative
Width, Positive Duty Cycle, and
Negative Duty Cycle.
Click Clear All to remove all measurements from the Measurements table.
Code Log Panel
The Code Log tab in the bottom panel displays the MATLAB
commands equivalent to your actions in the app. The log updates in real time as you
interact with the oscilloscope. To save the log as a live script, set the
Export parameter to Export MATLAB Code
Log.
Version History
Introduced in R2026b

