Determine Safe Landing Area for Aerial Vehicles
This example demonstrates how to determine a safe landing area for aerial vehicles, such as helicopters and UAVs, by using aerial lidar data.
Aerial vehicles are increasingly used for applications like cargo delivery, casualty evacuation, and search and rescue operations. For these applications, the aerial vehicle must land safely in the vicinity of the destination. Because landing an aerial vehicle based on limited visual information is a challenging task for a pilot, aerial vehicles benefit from using lidar data to perform, reducing the pressure on the pilot and the risk of an accident.
Use these steps to detect safe landing zones from aerial lidar data:
Load the point cloud into the workspace.
Divide the point cloud into overlapping blocks.
Identify the non-flat points, and label these points as dangerous.
Identify and label the points around the dangerous points as unsuitable.
Identify and label the points around the unsuitable points as risky. Also, label those points that do not satisfy the parameter thresholds as risky.
Identify the safe landing zones.
You must avoid the dangerous and unsuitable points for landing, as these carry a very high chance of causing an accident. The probability of accidents is lower at the risky points, but the terrain points labeled as suitable are the safest for landing.
Load and Visualize Data
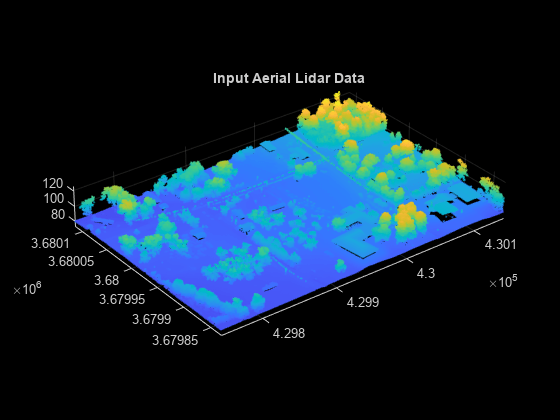
This example uses the point cloud data from the LAZ file aerialLidarData.laz, obtained from the Open Topography Dataset [1]. Load the point cloud data into the workspace using the readPointCloud function of the lasFileReader object, and visualize the point cloud.
% Set random seed to generate reproducible results
rng("default")

% Specify the LAZ file path
lasfile = fullfile(toolboxdir("lidar"),"lidardata","las","aerialLidarData.laz");

% Create a lasFileReader object
lasReader = lasFileReader(lasfile);

% Read the point cloud
ptCloud = readPointCloud(lasReader);

% Visualize the point cloud
figure
pcshow(ptCloud)
axis on
title("Input Aerial Lidar Data")
Divide Point Cloud into Blocks
Divide the input point cloud into overlapping blocks. Each block consists of an inner block and an outer block. First, specify the size of the inner block.
% Specify the inner block size (in meters)
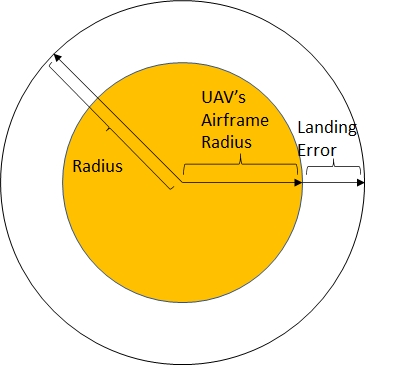
innerBlockSize = [20 20];The outer block size is the sum of the inner block size and landing site radius. Specify the landing site radius.
% Specify the radius of the landing site to be evaluated (in meters)
radius = 5;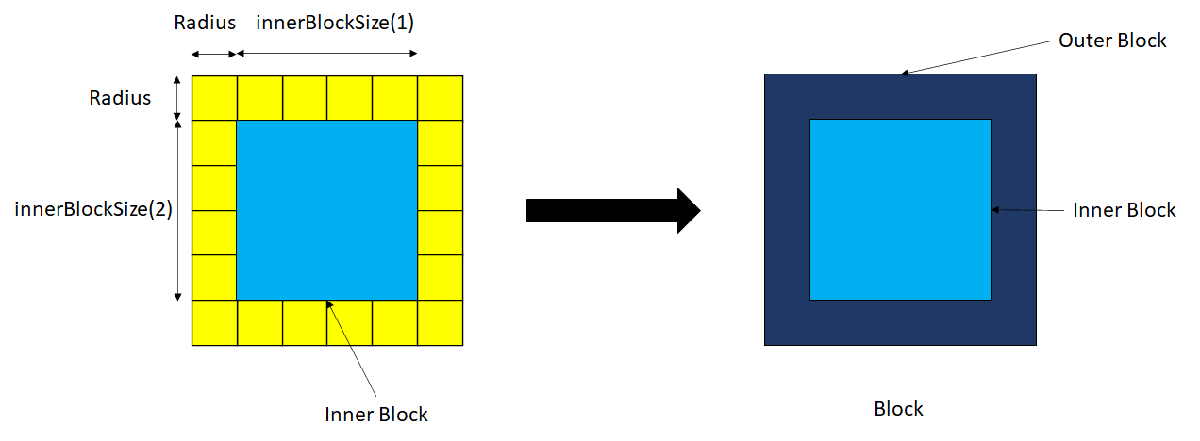
The landing site radius is the sum of the airframe radius of the aerial vehicle and the landing error, as shown in this figure.
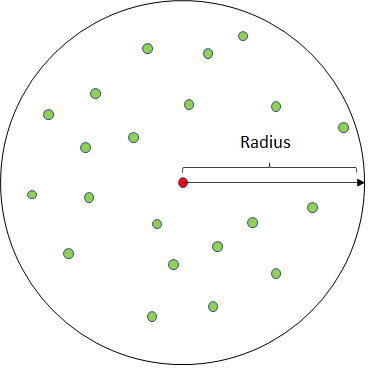
While labeling, you label only the points in the inner block. You determine the label of each point in the inner block by evaluating the parameters of that point and its nearest neighbors within the landing site radius.
For example, to assign a label to the red point in this figure, you must evaluate the properties of the red point and its neighbors within the radius, represented by the green points.
The block processing starts from the eft and proceeds to the right, then repeats from bottom to top until all the blocks have been covered. Define the overlap between two adjacent blocks such that the inner blocks of the adjacent blocks lay side-by-side without any overlap with each other, as shown in this figure.
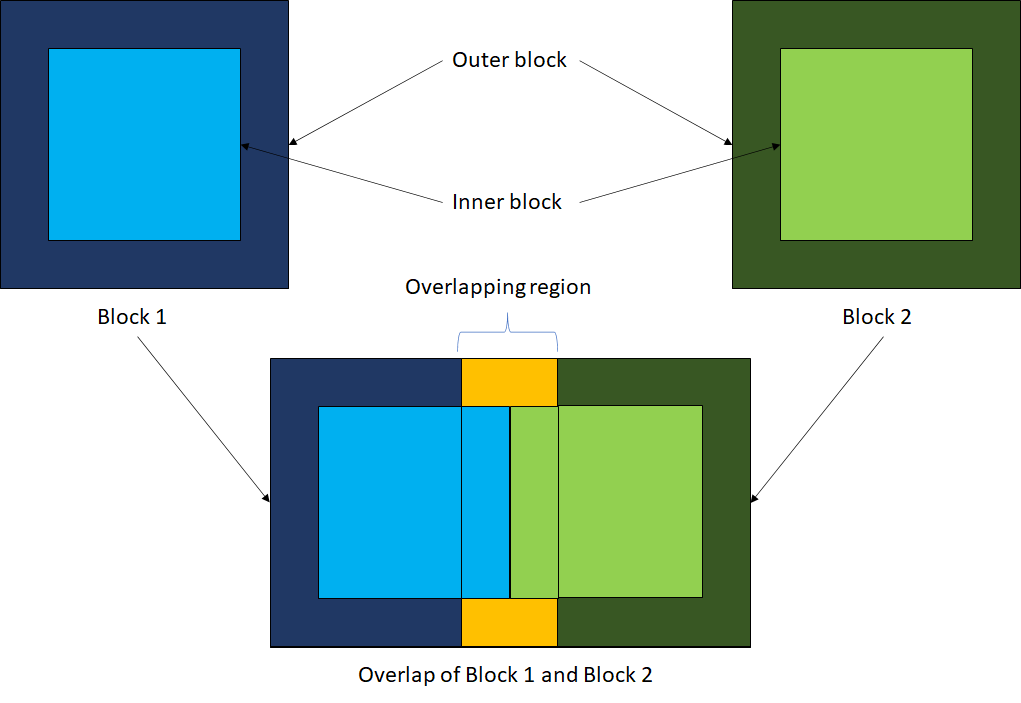
Use the helperOverlappingBlocks helper function, attached to this example as a supporting file, to compute the parameters required for overlapping-block-based processing. These parameters contain the indices of the outer blocks, inner blocks, and boundary points. The function also outputs the mapping for each block between the inner block, outer block, and labels.
[outerBlockIndices,innerBlockIndices, ...
    innerBlockToOuterBlock,innerBlockIndFromLabels, ...
    innerBlockIndFromOuterBlock,boundaryIndices] = helperOverlappingBlocks(ptCloud, ...
    radius,innerBlockSize);
Define the class labels for classifying each point.
classNames = [
    "Unlabeled"
    "Dangerous"     % Label 1
    "Unsuitable"    % Label 2
    "Risky"         % Label 3
    "Suitable"      % Label 4
    ];
You use the overlapping block processing parameters when labeling the unsuitable and risky points. Use overlapping block processing to improve the run-time performance of the labeling algorithm on larger point clouds.
Classify Dangerous Points
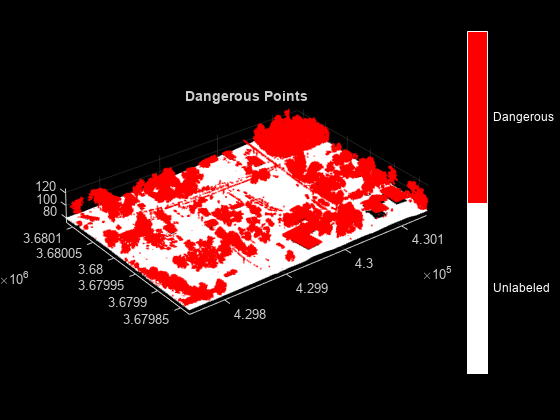
A good landing zone must be a flat terrain surface with minimal obstacles, as landing an aerial vehicle on non-flat points is dangerous, and can result in an accident. You must further evaluate the flat terrain points to analyze their safety.
Flat terrain points generally consist of the ground points, while non-flat points generally consist of trees, buildings, and other non-ground points.
Segment the input point cloud into ground and non-ground points, using the segmentGroundSMRF function. Label the non-ground points as dangerous.
% Store the label of each point in a labels array
labels = nan(ptCloud.Count,1);

% Identify the ground points
flatIdx = segmentGroundSMRF(ptCloud);

% Mark the non-ground points as dangerous
labels(~flatIdx) = 1;

% Use the helperViewOutput helper function, defined at the end of the
% example, to visualize the output
helperViewOutput(ptCloud,labels,classNames)
title("Dangerous Points")
Classify Unsuitable Points
Label a point as unsuitable in any of these cases:
The point is along the boundary of the point cloud.
There are dangerous points in the neighborhood of the point.
The point does not have enough neighboring points, and further evaluation is not possible.
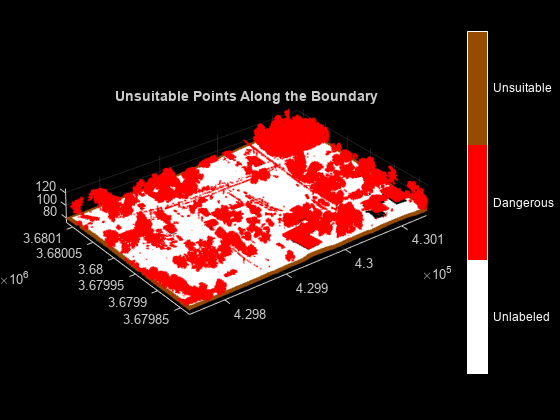
Classify Unsuitable Boundary Points
Because you cannot assess the entire neighborhood of the points along the boundary of the point cloud, label any unlabeled boundary points as unsuitable.
% Identify the unlabeled boundary points
unlabeledBoundaryIndices = isnan(labels(boundaryIndices));

% Label these points as unsuitable
labels(boundaryIndices(unlabeledBoundaryIndices)) = 2;

% Use the helperViewOutput helper function, defined at the end of the
% example, to visualize the output
helperViewOutput(ptCloud,labels,classNames)
title("Unsuitable Points Along the Boundary")
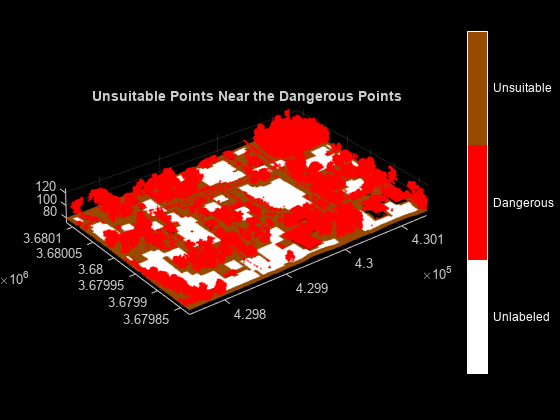
Classify Unsuitable Points Around Dangerous Points
Landing an aerial vehicle lands near dangerous points can result in an accident during landing. Dangerous points consist of powerlines, trees, buildings, and other non-ground objects. Due to their height, these points might not be detected as a neighbors within the radius of the flat points. Use the helperUnsuitablePoints helper function to label points in the vicinity of the dangerous points as unsuitable.
% Define the grid size (in meters)
gridSize = 4;
Note: When you increase the gridSize value, the helperUnsuitablePoints function detects more points in the vicinity of each dangerous point, thus labeling more points as unsuitable.
% Identify the indices of the points near the dangerous points
unsuitableIdx = helperUnsuitablePoints(ptCloud,labels,gridSize);

% Label these points as unsuitable
labels(unsuitableIdx) = 2;

% Use the helperViewOutput helper function, defined at the end of the
% example, to visualize the output
helperViewOutput(ptCloud,labels,classNames)
title("Unsuitable Points Near the Dangerous Points")
Extract Indices of Nearest Neighbors for Unlabeled Points
Further classify unsuitable points by using overlapping-block-based processing, and compute the nearest neighbors for each unlabeled point.
If the number of neighbors is less than the minPoints value, or the neighborhood of the point contains dangerous points, label the point as unsuitable. Otherwise, store the indices of the neighboring points in the totalNeighborInd cell array.
% Define the minimum number of neighbors for each point
minPoints = 10;

% Store the indices of the nearest neighboring points around each point
% within the specified radius
totalNeighborInd = {};

% Perform block-by-block processing
for curBlockIdx = 1:numel(outerBlockIndices)
    % Extract the inner block point cloud from the input point cloud
    innerBlockPtCloud = select(ptCloud,innerBlockIndices{curBlockIdx});

    % Extract the outer block point cloud from the input point cloud
    outerBlockPtCloud = select(ptCloud,outerBlockIndices{curBlockIdx});

    % Extract the labels of the outer block
    curOuterBlockLabels = labels(outerBlockIndices{curBlockIdx});

    % Create a mapping from the inner block labels to the outer block labels
    curInnerBlockToOuterBlock = innerBlockToOuterBlock{curBlockIdx};
Use the helperNeighborIndices helper function, defined at the end of the example, to compute the nearest neighbor indices within the radius of each point. The function also labels a point as unsuitable if the number of nearest neighbors within the specified radius of that point is less than the minimum number of points.
    [labeledOuterBlock,neighborInd] = helperNeighborIndices( ...
        innerBlockPtCloud,outerBlockPtCloud,curOuterBlockLabels, ...
        curInnerBlockToOuterBlock,minPoints,radius);

    % Store the neighbor indices of the points belonging to the inner block
    totalNeighborInd = [totalNeighborInd; neighborInd];
Label only the inner block point cloud. Compute the indices of the inner block with respect to the labels and the outer block. Update the labels array with the labels computed for the inner block.
    labels(innerBlockIndFromLabels{curBlockIdx}) = labeledOuterBlock( ...
        innerBlockIndFromOuterBlock{curBlockIdx});
end

% Use the helperViewOutput helper function, defined at the end of the
% example, to visualize the output
helperViewOutput(ptCloud,labels,classNames)
title("Unsuitable Points Detected")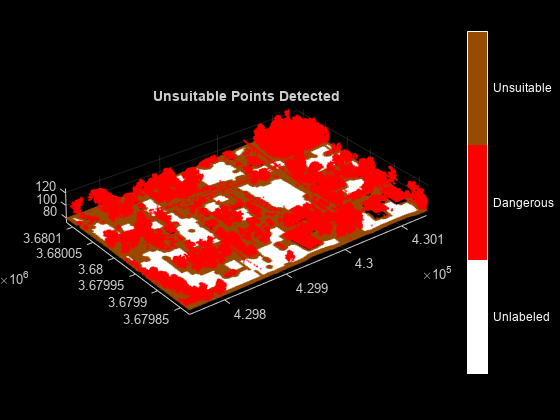
Classify Risky Points
Within the unlabeled points, label a point as risky, if it has unsuitable points in its neighborhood.
Also, evaluate these attributes of each unlabeled point and its neighboring points.
Vertical Variance — Variance of the points along the z-axis. A higher variance value indicates a greater height spread among the points, which can make them unsuitable for landing.
Relief — Height difference between the lowest and highest points in the neighborhood. A smaller relief value correlates with a flatter surface and fewer obstacles in the landing zone.
Slope — Inclination angle of the fitting plane. A smaller slope value is more suitable for landing, as indicates a more stable surface for the vehicle.
Residual — Roughness of the landing zone. A smaller roughness value indicates the presence of fewer obstacles and a smoother landing zone.
Note: Because a landing surface must be flat, lower values of the vertical variance and relief attributes ensure that you can fit a plane through the points. Based on the plane fitting, the algorithm computes the slope and residual attributes.
Specify the threshold values for these attributes. Any point, with an attribute value is greater than the respective threshold is a risky point.
% Define the vertical variance threshold (in meters)
verticalVarianceThreshold = 0.5;

% Define the slope threshold (in degrees)
slopeThreshold = 6;

% Define the residual threshold (in meters)
residualThreshold = 10;

% Define the relief threshold (in meters)
reliefThreshold = 3;

innerBlockIndicesCount = 1;
for curBlockIdx = 1:numel(outerBlockIndices)
    % Extract the inner block point cloud from the input point cloud
    innerBlockPtCloud = select(ptCloud,innerBlockIndices{curBlockIdx});

    % Extract the outer block point cloud from the input point cloud
    outerBlockPtCloud = select(ptCloud,outerBlockIndices{curBlockIdx});

    % Extract the labels of the outer block
    curOuterBlockLabels = labels(outerBlockIndices{curBlockIdx});

    % Map the inner block labels to the outer block labels
    curInnerBlockToOuterBlock = innerBlockToOuterBlock{curBlockIdx};
Use the helperLabelRiskyPts helper function, defined at the end of the example, to label the points in the vicinity of the unsuitable points as risky. Also, label the points whose slope, vertical variance, relief, or residual parameter is greater than the corresponding threshold as risky.
    [labeledOuterBlock,updatedInnerBlockIndicesCount, ...
        updatedTotalNeighborInd] = helperLabelRiskyPts( ...
        innerBlockIndicesCount,totalNeighborInd,innerBlockPtCloud, ...
        outerBlockPtCloud,curOuterBlockLabels, ...
        curInnerBlockToOuterBlock, ...
        verticalVarianceThreshold,slopeThreshold,residualThreshold,...
        reliefThreshold);

    totalNeighborInd = updatedTotalNeighborInd;
    innerBlockIndicesCount = updatedInnerBlockIndicesCount;
Label only the inner block point cloud. Compute the indices of the inner block with respect to the labels and the outer block. Update the labels array with the labels computed for the inner block.
    labels(innerBlockIndFromLabels{curBlockIdx}) = labeledOuterBlock( ...
        innerBlockIndFromOuterBlock{curBlockIdx});
end

% Use the helperViewOutput helper function, defined at the end of the
% example, to visualize the output
helperViewOutput(ptCloud,labels,classNames)
title("Risky Points Detected")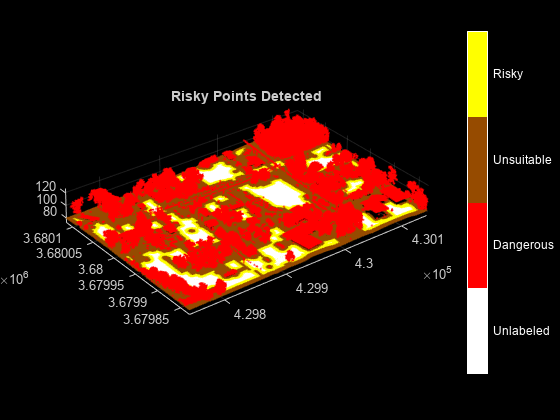
Classify Safe Landing Zones
The remaining unlabeled points, which satisfy the parameter threshold values, are the safe landing points. There are no dangerous or unsuitable points around these points. Label these points as suitable.
% Label the remaining unlabeled points as suitable
labels(isnan(labels)) = 4;

% Use the helperViewOutput helper function, defined at the end of the
% example, to visualize the output
helperViewOutput(ptCloud,labels,classNames)
title("Landing Zones Detected")

Helper Functions
The helperViewOutput helper function visualizes the point cloud along with the class labels.
function helperViewOutput(ptCloud,labels,classNames)
labels = labels + 1;
labels(isnan(labels)) = 1;

% Display the point cloud along with the labels
ax = pcshow(ptCloud.Location,labels);
axis on

labels = unique(labels);
cmap = [[255 255 255];  % White Color (Unlabeled Points)
        [255  0   0];   % Red Color (Dangerous Points)
        [150  75  0];   % Brown Color (Unsuitable Points)
        [255  255 0];   % Yellow Color (Risky Points)
        [0    255 0]];  % Green Color (Suitable Points)
cmap = cmap./255;
cmap = cmap(labels,:);
colormap(ax,cmap)

% Add colorbar to current figure
c = colorbar(ax);
c.Color = "w";
numClasses = numel(labels);

% Center tick labels and use class names for tick marks
c.Ticks = linspace(c.Ticks(1)+(c.Ticks(end)-c.Ticks(1))/(2*numClasses), ...
    c.Ticks(end)-(c.Ticks(end)-c.Ticks(1))/(2*numClasses), ...
    numClasses);
c.TickLabels = classNames(labels);

% Remove tick mark
c.TickLength = 0;
end
The helperNeighborIndices helper function returns the nearest neighbor indices within the specified radius of each point. The function also labels a point as unsuitable when the number of neighbors within the specified radius for the point is less than the specified minimum number of points, or when the point has dangerous points in its neighborhood.
function [curLabels,curNeighborInd] = helperNeighborIndices( ...
    innerBlockPtCloud,outerBlockPtCloud,curLabels, ...
    curInnerBlockLabelsToOuterBlockLabels,minPoints,radius)
curNeighborInd = cell(innerBlockPtCloud.Count,1);
for i = 1:innerBlockPtCloud.Count
    % Compute nearest neighbor for only the unlabeled points
    if isnan(curLabels(curInnerBlockLabelsToOuterBlockLabels(i)))

        % Find the nearest neighbors within radius for each point
        [indices,~] = findNeighborsInRadius(outerBlockPtCloud, ...
            innerBlockPtCloud.Location(i,:),radius);

        % If the number of neighbors is less than the minimum neighbors,
        % label the point as unsuitable
        if numel(indices) < minPoints
            curLabels(curInnerBlockLabelsToOuterBlockLabels(i)) = 2;
            continue
        end

        % If the point is unlabeled and there are dangerous points present in
        % the vicinity of the point, label the point as unsuitable
        if any(curLabels(indices) == 1) && ...
                isnan(curLabels(curInnerBlockLabelsToOuterBlockLabels(i)))
            curLabels(curInnerBlockLabelsToOuterBlockLabels(i)) = 2;
            continue
        end

        curNeighborInd{i} = indices;
    end
end
end
The helperLabelRiskyPts helper function labels the points in the vicinity of the unsuitable points as risky. Additionally, it evaluates a point and its neighbors based on specified attributes. The function labels a point as risky if any of its attribute values is greater than the specified threshold.
function [curLabels,innerBlockIndicesCount, ...
    totalNeighborInd] = helperLabelRiskyPts(innerBlockIndicesCount, ...
    totalNeighborInd,innerBlockPtCloud,outerBlockPtCloud,curLabels, ...
    curInnerBlockLabelsToOuterBlockLabels, ...
    verticalVarianceThreshold,slopeThreshold,residualThreshold, ...
    reliefThreshold)
for i = 1:innerBlockPtCloud.Count
    indices = totalNeighborInd{innerBlockIndicesCount};
    innerBlockIndicesCount = innerBlockIndicesCount + 1;

    if ~isempty(indices) && ...
            isnan(curLabels(curInnerBlockLabelsToOuterBlockLabels(i)))

        % If the point has neighbors, the point is unlabeled. and there
        % are unsuitable points in the vicinity of the point, label the
        % point as risky
        if any(curLabels(indices) == 2)
            curLabels(curInnerBlockLabelsToOuterBlockLabels(i)) = 3;
            totalNeighborInd{innerBlockIndicesCount-1} = [];
            continue
        end

        % Evaluate the point for the vertical variance attribute
        verticalVariance = var(outerBlockPtCloud.Location(indices,3));
        if verticalVariance > verticalVarianceThreshold
            curLabels(curInnerBlockLabelsToOuterBlockLabels(i)) = 3;
            totalNeighborInd{innerBlockIndicesCount-1} = [];
            continue;
        end

        % Evaluate the point for the relief attribute
        relief = max(outerBlockPtCloud.Location(indices,3)) ...
            -min(outerBlockPtCloud.Location(indices,3));
        if relief > reliefThreshold
            curLabels(curInnerBlockLabelsToOuterBlockLabels(i)) = 3;
            totalNeighborInd{innerBlockIndicesCount-1} = [];
            continue
        end

        % Perform the plane fitting operation on the point and its
        % neighbors
        [model,~,outlierIndices] = pcfitplane(pointCloud( ...
            outerBlockPtCloud.Location(indices,:)), ...
            0.3,[0,0,1]);

        % Evaluate the point for the slope attribute
        slope = acosd(model.Normal(3));
        if slope > slopeThreshold
            curLabels(curInnerBlockLabelsToOuterBlockLabels(i)) = 3;
            totalNeighborInd{innerBlockIndicesCount-1} = [];
            continue
        end

        % Evaluate the point for the residual attribute
        residual = rms(abs(outerBlockPtCloud.Location(outlierIndices,:) ...
            *model.Parameters(1:3)' + model.Parameters(4)));
        if residual > residualThreshold
            curLabels(curInnerBlockLabelsToOuterBlockLabels(i)) = 3;
            totalNeighborInd{innerBlockIndicesCount-1} = [];
            continue
        end
    end
end
end
References
[1] OpenTopography. “Tuscaloosa, AL: Seasonal Inundation Dynamics And Invertebrate Communities,” 2011. https://doi.org/10.5069/G9SF2T3K.
[2] Yan, Lu, Juntong Qi, Mingming Wang, Chong Wu, and Ji Xin. "A Safe Landing Site Selection Method of UAVs Based on LiDAR Point Clouds." In 2020 39th Chinese Control Conference (CCC), 6497–6502. Shenyang, China: IEEE, 2020.https://doi.org/10.23919/CCC50068.2020.9189499.
See Also
lasFileReader | segmentGroundSMRF