Add Labels and Annotations to Map Axes
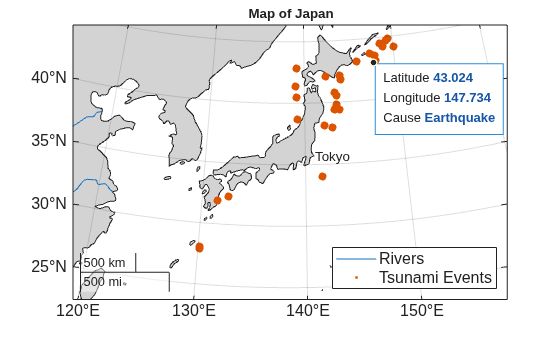
R2026bMap axes objects are a type of axes object, similar to axes objects, geographic axes objects, and polar axes objects. As a result, you can use map axes with many MATLAB® graphics functions. This example shows how to convey information about your map by adding a title, a legend, text, and data tips.
By default, most plotting functions reset many of the axes properties. This example retains the plots and customizations in the axes by setting the hold state of the axes to on. Alternatively, you can customize the axes after plotting.
Create Map
Create a map with a projection that is appropriate for Japan.
figure
newmap("Japan")
hold on
Provide geographic context for the map by displaying a shapefile of land areas. Avoid displaying the land areas in the legend by setting the HandleVisibility property to "off". Display the land areas in a neutral color by setting the SeriesIndex property to "none".
land = readgeotable("easternhemisphere.shp");
geoplot(land,HandleVisibility="off",SeriesIndex="none",FaceAlpha=0.2)
Display world rivers using lines.
rivers = readgeotable("worldrivers.shp");
geoplot(rivers)
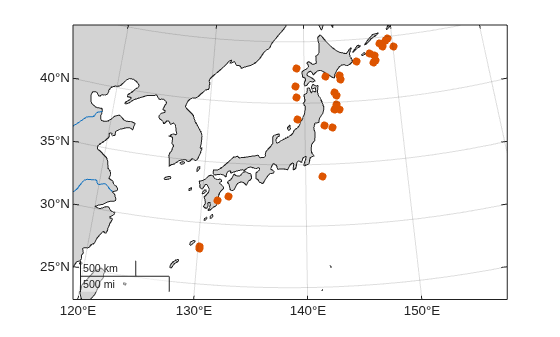
Display the locations of tsunamis events using points. Prepare to add data tips to the points by returning the Point object as pt.
tsunamis = readgeotable("tsunamis.shp",CoordinateSystemType="geographic");
pt = geoplot(tsunamis,MarkerSize=18);
Add Title
Add a title using the title function.
title("Map of Japan")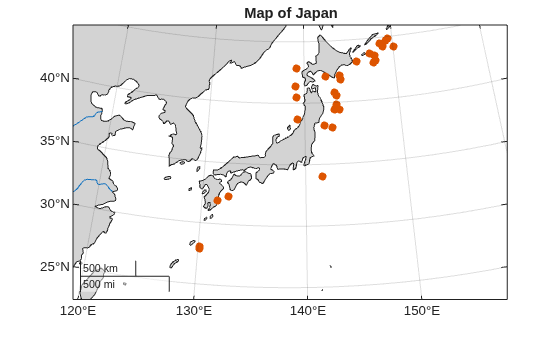
Add Legend
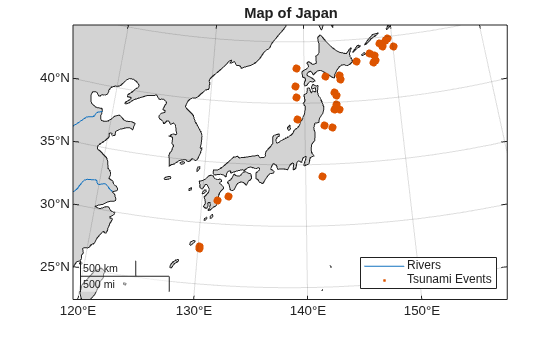
Add a legend with descriptions for the lines and scatter chart. Specify the legend labels as inputs to the legend function. For more information about adding legends to axes, see Add Legend to Graph.
legend(["Rivers","Tsunami Events"],Location="southeast")
Change Font Size
Change the font size by using the fontsize function. The fontsize function affects the sizes of fonts used in the title, tick labels, and scale bar, as well as any legends or color bars associated with the axes.
fontsize(12,"points")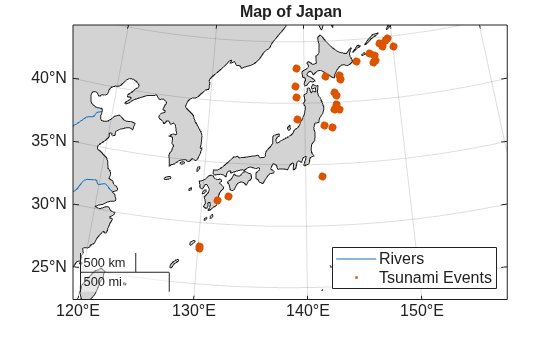
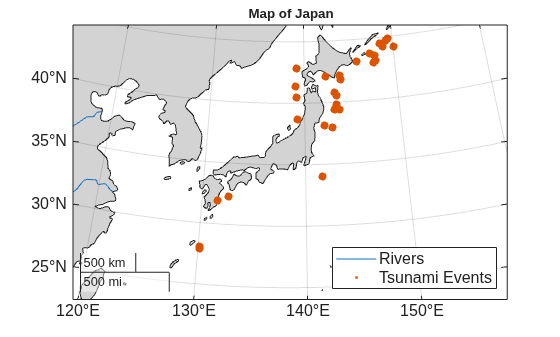
To change the font size of only the title, access the title of the current MapAxes object. Then, set the FontSize property of the title.
mx = gca;
mx.Title.FontSize = 10;
Add Text
Add text to the map. Specify the location for the text using latitude-longitude coordinates. For more information about adding text to axes, see Add Text to Chart.
text(35.6,141,"Tokyo")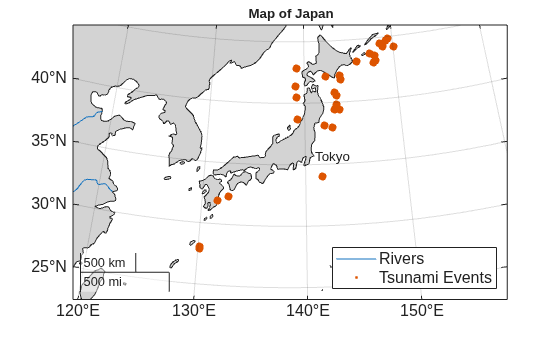
Add Data Tips
Display the coordinates of a tsunami event by adding a data tip. Specify the Point object and latitude-longitude coordinates as inputs to the datatip function.
dt = datatip(pt,43.024,147.734,Location="southeast");Display the cause of the tsunami event in the data tip by adding a new row to the data tip template. For more information about customizing data tips, see Add Data Tips to Point, Line, and Polygon Shapes.
dtRow = dataTipTextRow("Cause",tsunamis.Cause);
pt.DataTipTemplate.DataTipRows(end+1) = dtRow;