Combine Vector Data Using Table Joins
To link vector data from one file to vector data with shared attributes from other files, import the files as tables and use a table join. A table join combines two tables by row according to key variables such as state names, alphanumeric IDs, or Federal Information Processing System (FIPS) codes.
This example shows you how to read data from two different files into separate tables, join the tables, create a choropleth map from the joined table, and export the joined table into a shapefile.
Read Data into Tables
Read a comma-separated text file into a table. The file contains farmland statistics for each US state and the District of Columbia, based on the National Agricultural Statistics Service (NASS) Farms and Land in Farms 2019 Summary. For more information about the statistics, see [1]. Display the first row of the table.
farms = readtable("farmland.txt",TextType="string");
farms(1,:)
ans=1×4 table
    StateName    NumberOfFarms    AcresInFarms    AverageFarmSize
    _________    _____________    ____________    _______________

    "Alabama"        38800            8300              214
To create a map from the table, you also need spatial information. Read a shapefile containing polygon shapes for each of the US states and the District of Columbia into a geospatial table. A geospatial table has a Shape variable containing shape information for each row. Display the first row of the geospatial table.
states = readgeotable("usastatelo.shp");
states(1,:)ans=1×5 table
Shape Name LabelLat LabelLon PopDens2000
____________ _________ ________ ________ ___________
geopolyshape "Alabama" 32.283 -86.921 87.6
The Shape variable of the table contains geopolyshape objects, which are polygons in geographic coordinates. Display the properties of the geopolyshape object in the first row.
states.Shape(1)
ans =
  geopolyshape with properties:

              NumRegions: 1
                NumHoles: 0
                Geometry: "polygon"
    CoordinateSystemType: "geographic"
           GeographicCRS: [1×1 geocrs]
Join Tables
Join the tables, using the state name variables Name and StateName as the key variables.
statesFarms = outerjoin(states,farms,LeftKey="Name",RightKey="StateName");
The outerjoin function creates a table that includes rows where the key variables from one input table have no matches in the other input table. As a result, the output table can have more rows than either of the input tables. To create a table that includes the rows from one input table and appends rows where the key variables match values in the key variables of the other input table, use the join function instead. To create a table that includes only the rows where the key variables from one input table have matching values in the other input table, use the innerjoin function instead.
Inspect Joined Table
Mismatches in key variables can cause unexpected results in the joined table. Inspect the joined table by displaying the number of rows.
height(statesFarms)
ans =
52
Each input table contains 51 rows, but the joined table contains 52 rows. Because the state names are the key variables, this result indicates a mismatch in the names.
The table of farmland statistics identifies the District of Columbia as Washington DC, which does not match the corresponding row of the table of polygon shapes. Change the name in the table of farmland statistics so that it matches the name in the table of polygon shapes.
dcRow = farms.StateName == "Washington DC";
farms.StateName(dcRow) = "District of Columbia";
Join the tables again and display the number of rows in the joined table.
statesFarms = outerjoin(states,farms,LeftKey="Name",RightKey="StateName");
height(statesFarms)
ans =
51
The number of rows in the output table matches the number of rows in the input table.
Sort the joined table by average farm size and store the top eight rows in a subtable.
statesFarms8 = topkrows(statesFarms,8,"AverageFarmSize");Create Map
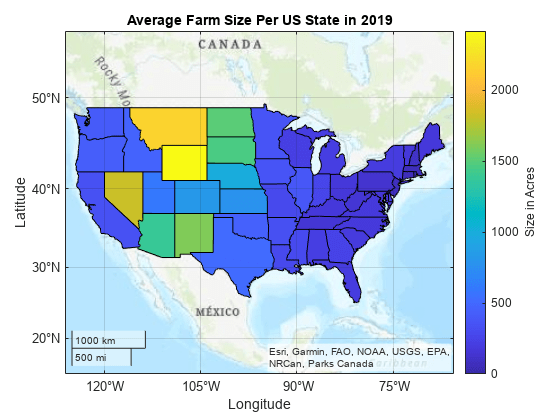
Create a choropleth map of average farm size for the conterminous US.
figure
rows = statesFarms.Name ~= "Hawaii" & statesFarms.Name ~= "Alaska";
geoplot(statesFarms(rows,:),ColorVariable="AverageFarmSize")
geobasemap topographic
Add a title and colorbar.
title("Average Farm Size Per US State in 2019")
cb = colorbar;
cb.Label.String = "Size in Acres";
Export Table as Shapefile
Export the joined table as a new shapefile.
shapewrite(statesFarms,"usastatelo_farmland.shp")References
[1] National Agricultural Statistics Service. “Number of Farms, Land in Farms, and Average Farm Size — States and United States: 2018–2019.” In Farms and Land in Farms 2019 Summary, 6. USDA, February 2020. https://www.nass.usda.gov/Publications/Todays_Reports/reports/fnlo0220.pdf.