Display Buildings from OpenStreetMap Files
This topic shows how to read building footprints from OpenStreetMap® files into geospatial tables, and then visualize the attributes of the buildings on 2-D maps using colors and data tips. For information about displaying buildings from OpenStreetMap files on 3-D globes, see addCustomBuildings.
When you read buildings from an OpenStreetMap file by using the readgeotable function, the function derives information about the buildings from the file and stores the result in a geospatial table. The geospatial table contains the building footprints, the footprint centroids, and information such as the building heights, colors, and materials.
Read Buildings from OpenStreetMap File
Read the buildings layer from an OpenStreetMap file [1] containing data for several city blocks in Shibuya, Tokyo, Japan. The buildings within the file have edited colors and materials. The output geospatial table represents the buildings using polygon shapes in geographic coordinates.
buildingsLayer = readgeotable("shibuya.osm",Layer="buildings");
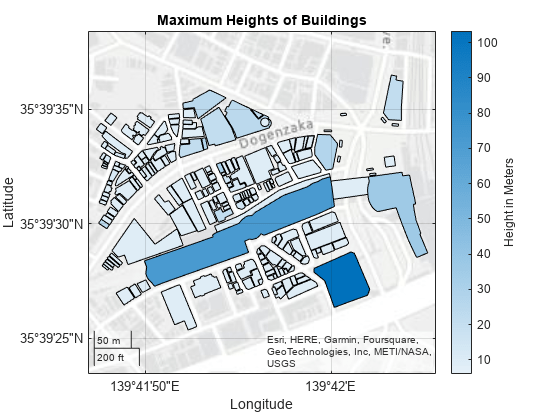
Visualize Maximum Heights of Buildings
The geospatial table stores the heights of the buildings in the MaxHeight table variable. Display the building footprints on a map by using the geoplot function. Vary the plot colors with the heights by specifying the ColorVariable name-value argument.
figure
geoplot(buildingsLayer,ColorVariable="MaxHeight")
Add a title, change the colormap, and add a labeled color bar.
title("Maximum Heights of Buildings")
colormap sky
c = colorbar;
c.Label.String = "Height in Meters";
Visualize Building Materials
The geospatial table stores the building materials in the Material table variable. Visualize the building footprints using a different color for each material.
When an OpenStreetMap file does not specify the material of a building, the table stores the Material value as "". For readability, find the table rows that do not specify a building material and replace "" with "unknown".
idxNoMaterial = buildingsLayer.Material == "";
buildingsLayer.Material(idxNoMaterial) = "unknown";
Find the unique building materials stored in the table.
materials = unique(buildingsLayer.Material)
materials = 4×1 string
    "concrete"
    "glass"
    "stone"
    "unknown"
Display the building footprints on a road map. To create a legend from the materials, display the building footprints for each material using a loop. Within the loop:
Get a material from the list of unique materials.
Find the table rows that use the material.
Create a subtable from the table rows.
Display the buildings from the subtable.
figure
geobasemap streets
hold on

for k = 1:length(materials)
   m = materials(k);
   idxm = buildingsLayer.Material == m;
   rows = buildingsLayer(idxm,:);
   geoplot(rows,DisplayName=m);
end
Add a title and legend, and make the buildings more opaque.
title("Building Materials")
legend
alpha(1)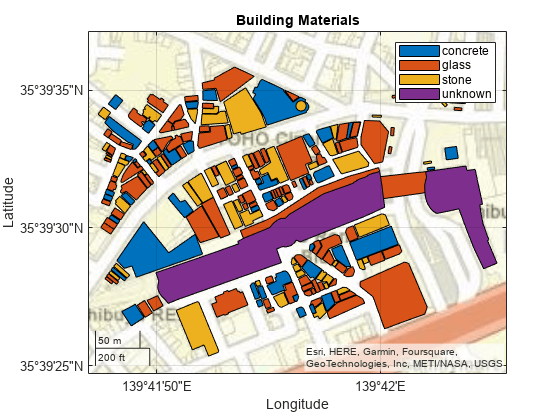
Visualize Building Colors
The geospatial table stores the building colors in the Color table variable. Visualize the building footprints using the colors stored in the file.
When an OpenStreetMap file does not specify the color of a building, the table stores the color as "". Find the table rows that do not specify a building material and replace "" with a dark gray color. Specify the color using a hexadecimal color code.
idxNoColor = buildingsLayer.Color == "";
buildingsLayer.Color(idxNoColor) = "#565656";
Find the unique color codes stored in the geospatial table.
colors = unique(buildingsLayer.Color)
colors = 5×1 string
    "#027880"
    "#3BAA32"
    "#565656"
    "#808000"
    "#8E4585"
Display the building footprints on a road map. To apply each color, display the building footprints using a loop. Within the loop:
Get a color code from the list of color codes.
Find the table rows that use the color code.
Create a subtable from the table rows.
Display the buildings from the subtable. Specify the plot color using the color code.
figure
geobasemap streets
hold on

for k = 1:length(colors)
	c = colors(k);
	idxc = buildingsLayer.Color == c;
	rows = buildingsLayer(idxc,:);
	geoplot(rows,FaceColor=c);
end
Add a title and make the buildings more opaque.
title("Building Colors")
alpha(1)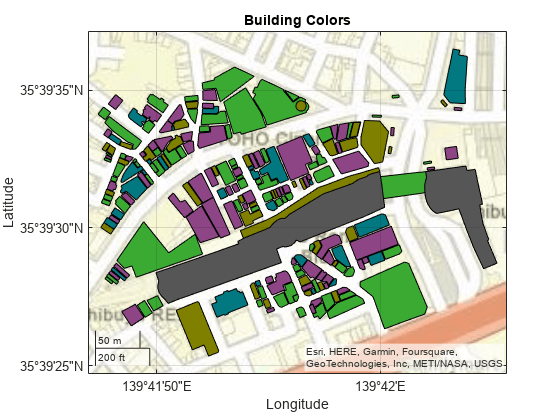
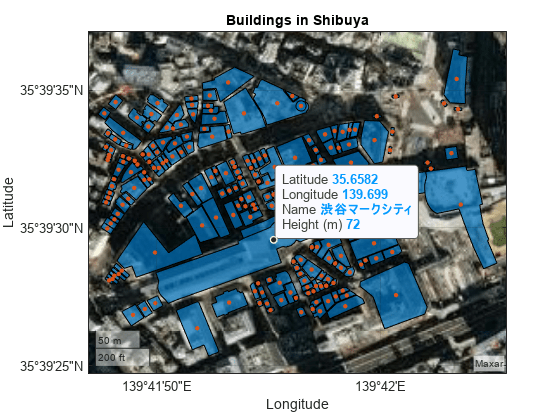
Add Data Tips to Buildings
Display the names and heights of buildings by using data tips.
When an OpenStreetMap file does not specify the name of a building, the table stores the name as "". Find the table rows that do not specify a building name and replace "" with "unknown".
idxNoName = buildingsLayer.Name == "";
buildingsLayer.Name(idxNoName) = "unknown";
Display the buildings using polygons over a satellite basemap. Prepare to add data tips to the buildings by returning the Polygon object as pg. Make the buildings more opaque.
figure
geobasemap satellite
pg = geoplot(buildingsLayer);
title("Buildings in Shibuya")
alpha(0.7)
Customize the content of the data tips by adding the building names and heights to the data tip template of the Polygon object. For more information about creating custom data tips on polygon shapes, see Add Data Tips to Point, Line, and Polygon Shapes.
dtRowName = dataTipTextRow("Name",buildingsLayer.Name);
pg.DataTipTemplate.DataTipRows(1) = dtRowName;

dtRowMaterial = dataTipTextRow("Height (m)",buildingsLayer.MaxHeight);
pg.DataTipTemplate.DataTipRows(2) = dtRowMaterial;
Find the table row that corresponds to the tallest building. Then, add a data tip to the tallest building. Specify the Polygon object and the row number as input to the datatip function.
tallest = max(buildingsLayer.MaxHeight);
idxTallest = find(buildingsLayer.MaxHeight == tallest);

dt = datatip(pg,DataIndex=idxTallest);
[1] You can download OpenStreetMap files from https://www.openstreetmap.org, which provides access to crowd-sourced map data all over the world. The data is licensed under the Open Data Commons Open Database License (ODbL), https://opendatacommons.org/licenses/odbl/.