geoclip
Description
clipped = geoclip(shape,latlim,lonlim)shape, the latitude limits
using latlim, and the longitude limits using
lonlim.
To crop raster data that is represented by an array and a geographic raster reference
object, use the geocrop function
instead.
clipped = geoclip(shape,clipperPolygon)
Examples
Read worldwide land areas as a geospatial table. Extract the polygon shapes.
land = readgeotable("landareas.shp");
shape = land.Shapeshape=537×1 geopolyshape array with properties:
NumRegions: [537×1 double]
NumHoles: [537×1 double]
Geometry: "polygon"
CoordinateSystemType: "geographic"
GeographicCRS: [1×1 geocrs]
⋮
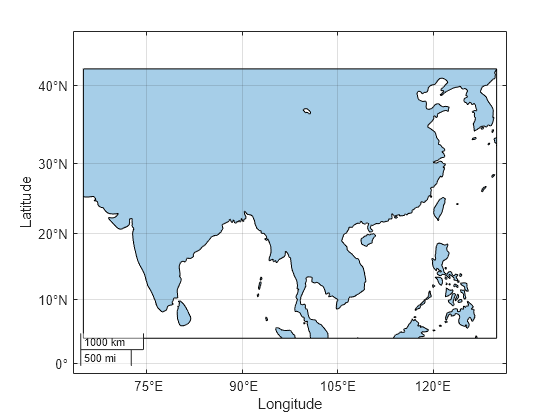
Specify the latitude and longitude limits for an area containing part of Asia. Then, clip the shapes.
latlim = [4 42];
lonlim = [65 130];
clipped = geoclip(shape,latlim,lonlim);
Display the clipped shapes on a map with no basemap. Display the bounding box as a rectangle.
figure
geobasemap none
hold on
geoplot(clipped)
geoplot(latlim([1 2 2 1 1]),lonlim([1 1 2 2 1]),"k")
Since R2024b
Read the locations of world cities as a geospatial table. The table represents the cities using point shapes in geographic coordinates. Extract the point shapes.
cities = readgeotable("worldcities.shp");
shape = cities.Shape
shape =
318×1 geopointshape array with properties:
NumPoints: [318×1 double]
Latitude: [318×1 double]
Longitude: [318×1 double]
Geometry: "point"
CoordinateSystemType: "geographic"
GeographicCRS: [1×1 geocrs]
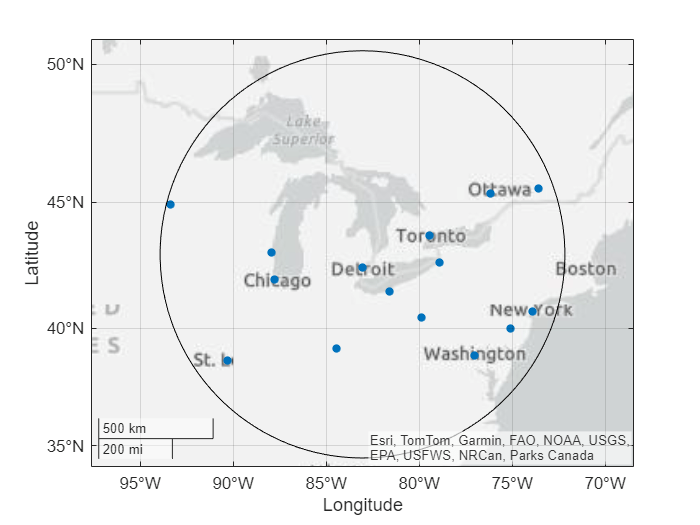
Specify the clipper polygon. Create a geospatial table that contains a point shape object for Detroit, Michigan. Then, define an area of interest (AOI) by creating a circle with a radius of 8 degrees that is centered on the point shape.
detroit = geocode("Detroit, MI","city");
clipperPolygon = aoicircle(detroit,8);
Clip the city locations to the AOI.
clipped = geoclip(shape,clipperPolygon);
Create a map that displays the clipped city locations and the AOI.
figure
geoplot(clipped,MarkerSize=15)
hold on
geoplot(clipperPolygon,FaceColor="none")
Read the names and locations of world cities as a geospatial table. Extract the point shapes.
cities = readgeotable("worldcities.shp");
shape = cities.Shape
shape =
318×1 geopointshape array with properties:
NumPoints: [318×1 double]
Latitude: [318×1 double]
Longitude: [318×1 double]
Geometry: "point"
CoordinateSystemType: "geographic"
GeographicCRS: [1×1 geocrs]
Specify the latitude and longitude limits for an area containing part of Asia. Then, clip the shapes.
latlim = [4 42];
lonlim = [65 130];
clipped = geoclip(shape,latlim,lonlim);
When a point shape lies outside the specified limits, the clipped shape has no coordinate data and the NumPoints property is 0. Remove shapes with no coordinate data from the clipped shapes.
idx = clipped.NumPoints ~= 0;
clipped = clipped(idx)
clipped =
  57×1 geopointshape array with properties:

               NumPoints: [57×1 double]
                Latitude: [57×1 double]
               Longitude: [57×1 double]
                Geometry: "point"
    CoordinateSystemType: "geographic"
           GeographicCRS: [1×1 geocrs]
When a line or polygon shape has no coordinate data, its respective NumParts or NumRegions property is 0.
Create a line shape in geographic coordinates from global coastline data. The longitude coordinates are in the range of –180 to 180 degrees.
load coastlines
coast = geolineshape(coastlat,coastlon)
coast =
geolineshape with properties:
NumParts: 241
Geometry: "line"
CoordinateSystemType: "geographic"
GeographicCRS: []
Shift the longitude coordinates so they are in the range of 0 to 360 degrees.
coastShift = geoclip(coast,[-90 90],[0 360]);
Display the shifted line shape on a map.
figure
geobasemap none
hold on
geoplot(coastShift)

Input Arguments
Output Arguments
Tips
If you clip a shape within a geospatial table, the function does not modify any attributes of the table.
If you do not know the latitude and longitude limits you want, you can open and explore a geographic axes by using the
geoaxesfunction. Return the limits of the axes by using thegeolimitsfunction or interactively select the southwest and northeast corners of a bounding box by using theginputfunction.