Clip Vector Data to Area of Interest
This topic shows how to clip vector data to an area of interest (AOI). Within the topic, you:
Read vector data from a file into a geospatial table. The geospatial table represents the data using point, line, and polygon shape objects.
Define an AOI. Mapping Toolbox™ represents AOIs using polygon shape objects. For information about creating AOIs, see Define Areas of Interest.
Clip the vector data to the AOI by using the
geoclipormapclipfunction.
To clip vector data to an AOI, these properties of the vector shape objects and the AOI must match:
The type of coordinate system. You can get the type of coordinate system for a shape object by querying the
CoordinateSystemTypeproperty.The coordinate reference system (CRS). For shape objects in a geographic coordinate system, you can get the CRS by querying the
GeographicCRSproperty. For shape objects in a planar coordinate system, you can get the CRS by querying theProjectedCRSproperty.
These examples show how to clip geographic and projected shape objects to an AOI.
Clip Geographic Shapes to AOI
Clip vector data in geographic coordinates to an AOI by using the geoclip function.
Read vector data from a shapefile of world cities into a geospatial table. The table represents the cities using point shapes in geographic coordinates. Extract the point shapes.
cities = readgeotable("worldcities.shp");
cShape = cities.Shape
cShape =
318×1 geopointshape array with properties:
NumPoints: [318×1 double]
Latitude: [318×1 double]
Longitude: [318×1 double]
Geometry: "point"
CoordinateSystemType: "geographic"
GeographicCRS: [1×1 geocrs]
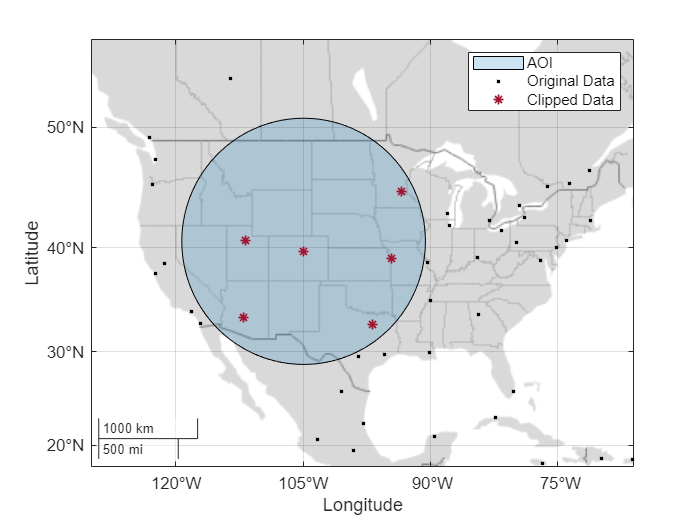
Define a circular AOI with a radius of 11 degrees that is centered on Denver, Colorado.
denver = geocode("Denver, CO","city");
dAOI = aoicircle(denver,11);
Verify that the city data and the AOI use the same type of coordinate system.
isequal(cShape.CoordinateSystemType,dAOI.CoordinateSystemType)
ans = logical
   1
Clip the city data to the AOI.
gClippedG = geoclip(cShape,dAOI);
Display the AOI, the original city data, and the clipped city data on a map. Prepare to add a legend by specifying a display name for each plot.
figure
geobasemap grayland
geoplot(dAOI,FaceAlpha=0.2,DisplayName="AOI")
hold on
geoplot(cShape,"k",DisplayName="Original Data")
geoplot(gClippedG,"*",MarkerEdgeColor="#A2142F",DisplayName="Clipped Data")
Add a legend. Get a clearer view of the clipped data by zooming in.
legend
geolimits([18 56],[-137 -58])
Clip Projected Shapes to AOI
Clip vector data in projected coordinates to an AOI by using the mapclip function.
Read vector data from a shapefile of Boston roads into a geospatial table. The table represents the roads using line shapes in projected coordinates. Extract the line shapes.
roads = readgeotable("boston_roads.shp");
rShape = roads.ShaperShape=2795×1 maplineshape array with properties:
NumParts: [2795×1 double]
Geometry: "line"
CoordinateSystemType: "planar"
ProjectedCRS: [1×1 projcrs]
⋮
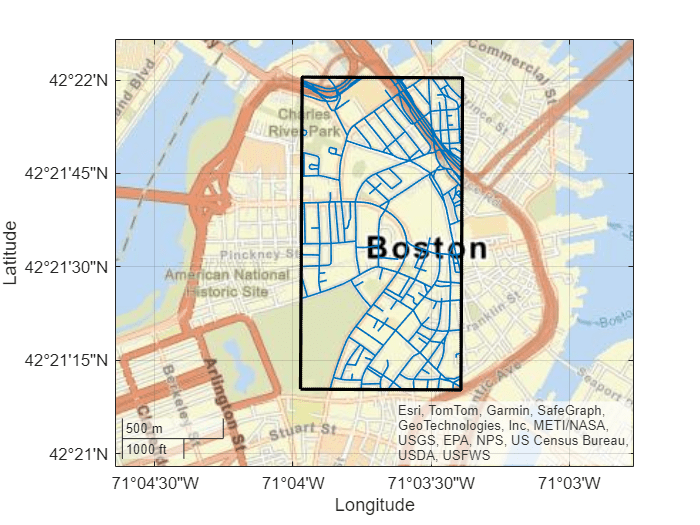
Read a shapefile containing the coordinates of locations in Boston as a geospatial table. The table represents the locations using point shapes in projected coordinates. Create a subtable by geocoding four of the locations. Then, define a quadrangular AOI that bounds the locations.
locations = readgeotable("boston_placenames.shp");
sublocations = geocode(["BOSTON","BOSTON NECK","BEACON HILL","COPPS HILL"],locations);

bAOI = aoiquad(sublocations)
bAOI =
  mappolyshape with properties:

              NumRegions: 1
                NumHoles: 0
                Geometry: "polygon"
    CoordinateSystemType: "planar"
            ProjectedCRS: [1×1 projcrs]
Verify that the road data and the AOI use the same type of coordinate system.
isequal(rShape.CoordinateSystemType,bAOI.CoordinateSystemType)
ans = logical
   1
Verify that the road data and the AOI use the same projected CRS.
isequal(rShape.ProjectedCRS,bAOI.ProjectedCRS)
ans = logical
   1
Clip the road data to the AOI.
rClipped = mapclip(rShape,bAOI);
Display the clipped road data and the boundary of the AOI on a map.
figure
geobasemap streets
geoplot(rClipped,LineWidth=1)
hold on
geoplot(bAOI,FaceColor="none",LineWidth=2)
Provide more geographic context for the data by zooming out.
geolimits([42.3517 42.3676],[-71.0734 -71.0407])
See Also
Functions
aoiquad|aoicircle|geocode|geoplot|readgeotable