aoiquad
Syntax
Description
Numeric Data
aoi = aoiquad(lat,lon)
Geospatial Table and Shape Data
Raster Data
Examples
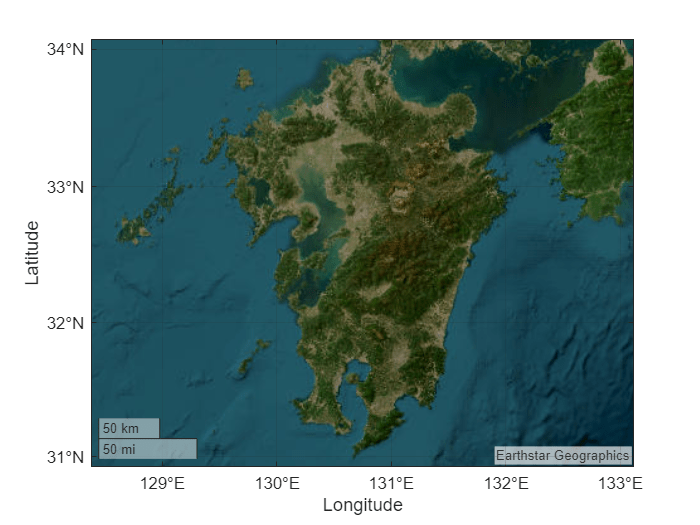
Specify the latitude and longitude limits for a region surrounding the island of Kyushu, Japan. Specify the geographic CRS as the World Geodetic System of 1984, which has the EPSG code 4326.
latlim = [31 34];
lonlim = [129 132.5];
gcrs = geocrs(4326);
Create a quadrangular AOI from the limits. When you pass geographic coordinates to the aoiquad function, the function represents the AOI using a scalar polygon shape in geographic coordinates.
aoi = aoiquad(latlim,lonlim,gcrs)
aoi =
  geopolyshape with properties:

              NumRegions: 1
                NumHoles: 0
                Geometry: "polygon"
    CoordinateSystemType: "geographic"
           GeographicCRS: [1×1 geocrs]
View satellite imagery for the region surrounding the AOI by plotting the AOI with no face or edge color.
geobasemap satellite
geoplot(aoi,FaceColor="none",EdgeColor="none")
Specify the projected coordinates for several places in Boston. Specify the projected CRS for the points as NAD83 / Massachusetts Mainland, which has the EPSG code 26986.
x = [234028 233569 235739 236266 234685 236536 234591 237114 235741 236548];
y = [900038 900190 901126 900974 901429 901901 901892 900670 900725 899587];
pcrs = projcrs(26986);
Create a rectangular AOI from the coordinates and the projected CRS. When you pass projected coordinates to the aoiquad function, the function represents the AOI using a scalar polygon shape in projected coordinates.
aoi = aoiquad(x,y,pcrs)
aoi =
  mappolyshape with properties:

              NumRegions: 1
                NumHoles: 0
                Geometry: "polygon"
    CoordinateSystemType: "planar"
            ProjectedCRS: [1×1 projcrs]
Display the AOI on a map.
geobasemap streets
geoplot(aoi)
Read road data for an area in Concord, MA as a geospatial table. The table represents the roads using line shapes in projected coordinates.
GT = readgeotable("concord_roads.shp");
GT.Shapeans=609×1 maplineshape array with properties:
NumParts: [609×1 double]
Geometry: "line"
CoordinateSystemType: "planar"
ProjectedCRS: [1×1 projcrs]
⋮
Create a rectangular AOI from the shapes in the geospatial table. When you pass data in projected coordinates to the aoiquad function, the function represents the AOI using a scalar polygon shape in projected coordinates.
aoi = aoiquad(GT)
aoi =
  mappolyshape with properties:

              NumRegions: 1
                NumHoles: 0
                Geometry: "polygon"
    CoordinateSystemType: "planar"
            ProjectedCRS: [1×1 projcrs]
Display the road data and the boundary of the AOI on a map. Display the boundary of the AOI using a thick, dashed line.
geoplot(GT)
hold on
geoplot(aoi,LineWidth=2,LineStyle="--",FaceColor="none")

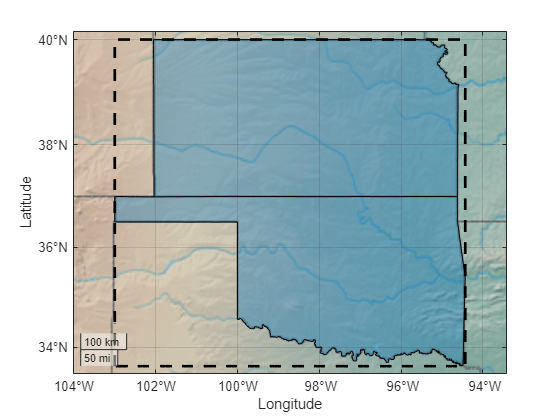
Create a geospatial table by geocoding the states of Kansas and Oklahoma. The table represents the states using polygon shapes in geographic coordinates.
GT = geocode(["Kansas","Oklahoma"],"state");
GT.Shape
ans=2×1 geopolyshape array with properties:
              NumRegions: [2×1 double]
                NumHoles: [2×1 double]
                Geometry: "polygon"
    CoordinateSystemType: "geographic"
           GeographicCRS: [1×1 geocrs]
Create a quadrangular AOI from the shapes in the geospatial table. When you pass data in geographic coordinates to the aoiquad function, the function represents the AOI using a scalar polygon shape in geographic coordinates.
aoi = aoiquad(GT)
aoi =
  geopolyshape with properties:

              NumRegions: 1
                NumHoles: 0
                Geometry: "polygon"
    CoordinateSystemType: "geographic"
           GeographicCRS: [1×1 geocrs]
Display the states and the boundary of the AOI on a map. Display the boundary of the AOI using a thick, dashed line.
geobasemap colorterrain
geoplot(GT)
hold on
geoplot(aoi,LineWidth=2,LineStyle="--",FaceColor="none")
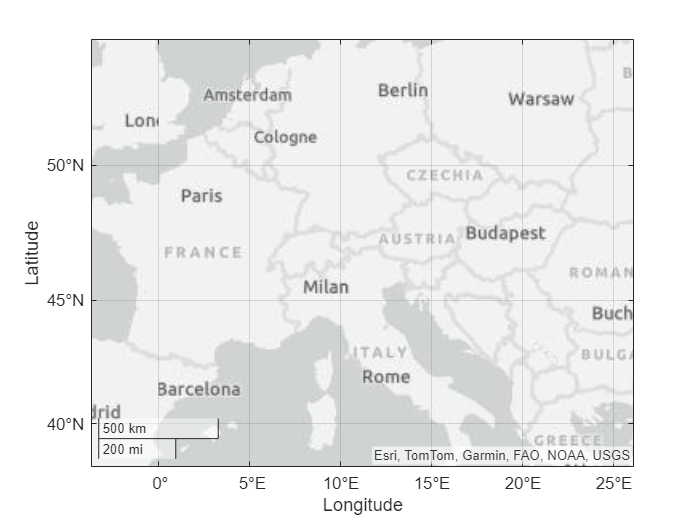
Read the geographic coordinates of European capitals into the workspace. Create a point shape object from the coordinates. Specify the geographic CRS as the World Geodetic System of 1984, which has the EPSG code 4326.
[lat,lon] = readvars("european_capitals.txt");
shape = geopointshape(lat,lon);
shape.GeographicCRS = geocrs(4326);
Create a quadrangular AOI from the shapes. When you pass data in geographic coordinates to the aoiquad function, the function represents the AOI using a scalar polygon shape in geographic coordinates.
aoi = aoiquad(shape);
Create a map using the latitude and longitude limits of the AOI. Note that, to maintain the aspect ratio of the map, the geolimits function typically uses wider limits than the limits you specify.
[latlim,lonlim] = bounds(aoi);
geolimits(latlim,lonlim)
Get the AOI for a raster data file. Then, display the AOI on a map. Displaying the AOI for a raster data file enables you to view the footprint of the file.
Get information about a raster data file by creating a RasterInfo object. Extract the raster reference from the object. The raster reference indicates that the raster is a grid of rectangular cells referenced to projected xy-coordinates.
info = georasterinfo("MountDartmouth-ft.grd");
R = info.RasterReference
R =
MapCellsReference with properties:
XWorldLimits: [300390 310770]
YWorldLimits: [4902150 4916340]
RasterSize: [473 346]
RasterInterpretation: 'cells'
ColumnsStartFrom: 'north'
RowsStartFrom: 'west'
CellExtentInWorldX: 30
CellExtentInWorldY: 30
RasterExtentInWorldX: 10380
RasterExtentInWorldY: 14190
XIntrinsicLimits: [0.5 346.5]
YIntrinsicLimits: [0.5 473.5]
TransformationType: 'rectilinear'
CoordinateSystemType: 'planar'
ProjectedCRS: [1×1 projcrs]
Create a rectangular AOI from the raster reference. When you pass data in projected coordinates to the aoiquad function, the function represents the AOI using a scalar polygon shape in projected coordinates.
aoi = aoiquad(R)
aoi =
  mappolyshape with properties:

              NumRegions: 1
                NumHoles: 0
                Geometry: "polygon"
    CoordinateSystemType: "planar"
            ProjectedCRS: [1×1 projcrs]
Note that the bounds of the AOI match the XWorldLimits and YWorldLimits properties of the raster reference.
[xlimits,ylimits] = bounds(aoi);
isequal(xlimits,R.XWorldLimits) && isequal(ylimits,R.YWorldLimits)
ans = logical
   1
Display the AOI on a map. The AOI represents the footprint of the raster data file.
geobasemap topographic
geoplot(aoi)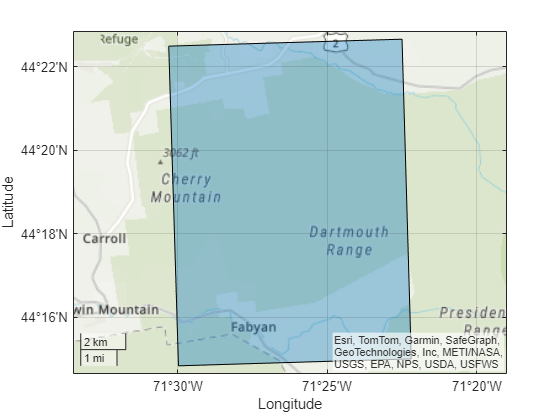
Since R2025a
By default, the aoiquad function creates AOIs with boundaries that follow linear paths. Create an AOI with boundaries that follow great-circle or geodesic paths by using the InterpolationMethod name-value argument.
Create a geospatial table by geocoding the cities of Denver, Colorado and Paris, France. The table represents the cities using point shapes in geographic coordinates.
cities = readgeotable("worldcities.shp");
GT = geocode(["Denver","Paris"],cities)
GT=2×2 table
             Shape               Name
    _______________________    ________

    (39.6888°N, 104.9425°W)    "Denver"
    (48.8708°N,   2.4131°E)    "Paris"
Create a quadrangular AOI from the shapes in the geospatial table. Calculate AOI boundaries that follow geodesic paths by specifying the InterpolationMethod name-value argument as "great-circle".
aoi = aoiquad(GT,InterpolationMethod="great-circle");Find points along a geodesic track from Denver to Paris by using the interpm function.
lat = GT.Shape.Latitude;
lon = GT.Shape.Longitude;
[lattrk,lontrk] = interpm(lat,lon,0.5,"gc");
Display the AOI and the geodesic track on a map.
figure
geoplot(aoi)
hold on
geoplot(lattrk,lontrk)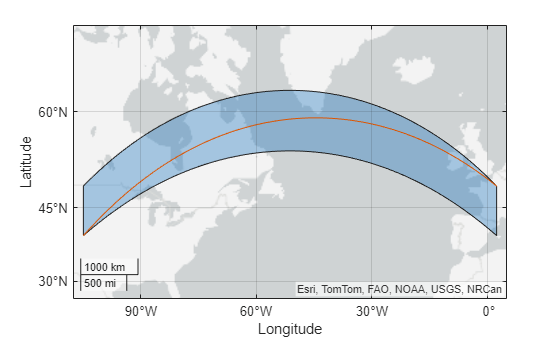
Export the footprint of a raster data file to a shapefile.
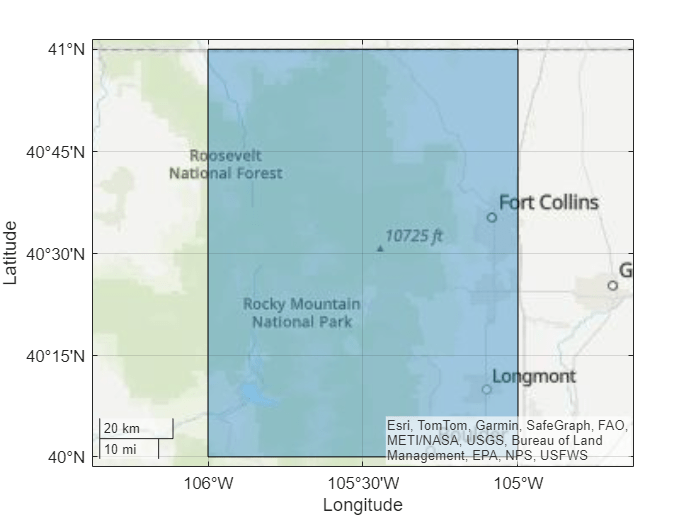
Get information about a DTED file by creating a RasterInfo object. Create an AOI from the raster reference that is stored in the RasterInfo object.
info = georasterinfo("n40_w106_3arc_v2.dt1");
R = info.RasterReference;
aoi = aoiquad(R);
Create a geospatial table from the AOI. Then, export the geospatial table to a shapefile by using the shapewrite function.
aoiGT = table(aoi,VariableName="Shape");
filename = "n40_w106_footprint.shp";
shapewrite(aoiGT,filename)
Read the shapefile into the workspace, and view the AOI.
GT = readgeotable(filename);
geobasemap topographic
geoplot(GT)