Crop Raster Data to Area of Interest
This topic shows how to crop raster data to an area of interest (AOI). Within the topic, you:
Read raster data from a file into an array and a raster reference object.
Define a quadrangular or rectangular AOI by using the
aoiquadandbufferfunctions. Mapping Toolbox™ represents AOIs using polygon shape objects.Get the bounds of the AOI by using the
boundsfunction.Crop the raster data to the bounds of the AOI by using the
geocropormapcropfunction.
To crop raster data to an AOI, these properties of the raster data and the AOI must match:
The type of coordinate system. You can get the type of coordinate system for a reference object or a shape object by querying the
CoordinateSystemTypeproperty.The coordinate reference system (CRS). For reference objects and shape objects in a geographic coordinate system, you can get the CRS by querying the
GeographicCRSproperty. For objects in a planar coordinate system, you can get the CRS by querying theProjectedCRSproperty.
These examples show how to crop geographic and projected raster data to an AOI.
Crop Geographic Raster to AOI
Crop raster data in geographic coordinates to an AOI by using the geocrop function.
Read elevation data from a DTED file into an array and a raster reference object. The reference object indicates that the raster is referenced to a grid of posting points in geographic coordinates.
[dtedZ,dtedR] = readgeoraster("n40_w106_3arc_v2.dt1",OutputType="double");
disp(dtedR)
  GeographicPostingsReference with properties:

              LatitudeLimits: [40 41]
             LongitudeLimits: [-106 -105]
                  RasterSize: [1201 1201]
        RasterInterpretation: 'postings'
            ColumnsStartFrom: 'north'
               RowsStartFrom: 'west'
     SampleSpacingInLatitude: 1/1200
    SampleSpacingInLongitude: 1/1200
      RasterExtentInLatitude: 1
     RasterExtentInLongitude: 1
            XIntrinsicLimits: [1 1201]
            YIntrinsicLimits: [1 1201]
        CoordinateSystemType: 'geographic'
               GeographicCRS: [1×1 geocrs]
                   AngleUnit: 'degree'
View the footprint of the DTED file on a map.
dtedFP = aoiquad(dtedR);
figure
geobasemap topographic
geoplot(dtedFP)
Identify the locations of three points within the footprint. To use predefined points, specify interactivelySelectPoints as false. To interactively select the points, specify interactivelySelectPoints as true.
interactivelySelectPoints = false;
if interactivelySelectPoints
    [lat,lon] = ginput(3);
else
    lat = [40.5130 40.4274 40.6064];
    lon = [-105.4439 -105.2516 -105.2427];
end
Create a quadrangular AOI from the points. Specify the geographic CRS as the World Geodetic System of 1984, which has the EPSG code 4326.
gcrs = geocrs(4326);
pointsAOI = aoiquad(lat,lon,gcrs);
Ensure the points are within the AOI, instead of on the boundary of the AOI, by adding a buffer of 0.05 degrees around the AOI.
pointsAOI = buffer(pointsAOI,0.05);
Verify that the DTED data and the AOI use the same type of coordinate system.
isequal(dtedR.CoordinateSystemType,pointsAOI.CoordinateSystemType)
ans = logical
   1
Verify that the DTED data and the AOI use the same geographic CRS.
isequal(dtedR.GeographicCRS,pointsAOI.GeographicCRS)
ans = logical
   1
Get the bounds of the AOI. Then, crop the DTED data to the bounds of the AOI.
[latlim,lonlim] = bounds(pointsAOI);
[dtedZcrop,dtedRcrop] = geocrop(dtedZ,dtedR,latlim,lonlim);
Display the footprint of the cropped DTED data over the footprint of the original DTED data.
dtedFPcrop = aoiquad(dtedRcrop);
hold on
geoplot(dtedFPcrop)
Using a new map, display the cropped DTED data as a surface. Unlike geoplot, the usamap and geoshow functions enable you to display geographic raster data on a map. For more information about selecting a map display, see Choose a 2-D Map Display.
figure
usamap(dtedZcrop,dtedRcrop)
geoshow(dtedZcrop,dtedRcrop,DisplayType="surface")
Apply a colormap that is appropriate for elevation data. Add a labeled color bar.
demcmap(dtedZcrop)
c = colorbar;
c.Label.String = "Elevation (m)";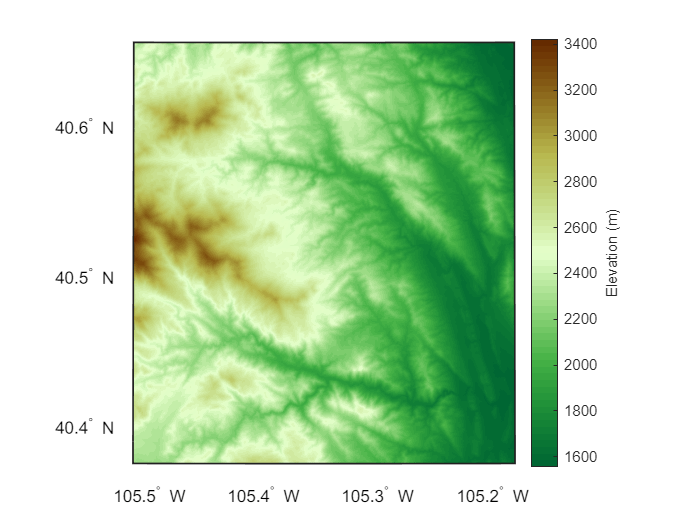
Crop Projected Data to AOI
Crop raster data in projected coordinates to an AOI by using the mapcrop function.
Read imagery of Boston into an array and a raster reference object. The reference object indicates that the raster is referenced to a grid of cells in projected coordinates.
[bostonA,bostonR] = readgeoraster("boston.tif");
disp(bostonR)
MapCellsReference with properties:
XWorldLimits: [764317.995579396 779019.409746063]
YWorldLimits: [2951122.28480912 2960574.36564245]
RasterSize: [2881 4481]
RasterInterpretation: 'cells'
ColumnsStartFrom: 'north'
RowsStartFrom: 'west'
CellExtentInWorldX: 3.28083333333333
CellExtentInWorldY: 3.28083333333333
RasterExtentInWorldX: 14701.4141666667
RasterExtentInWorldY: 9452.08083333332
XIntrinsicLimits: [0.5 4481.5]
YIntrinsicLimits: [0.5 2881.5]
TransformationType: 'rectilinear'
CoordinateSystemType: 'planar'
ProjectedCRS: [1×1 projcrs]
View the footprint of the imagery on a map.
bostonFP = aoiquad(bostonR);
figure
geoplot(bostonFP)

Read an outline of two Boston parks into a geospatial table. The table represents the parks using a polygon shape in projected coordinates.
parks = readgeotable("bostonparks.shp");
parks.Shape
ans =
mappolyshape with properties:
NumRegions: 1
NumHoles: 0
Geometry: "polygon"
CoordinateSystemType: "planar"
ProjectedCRS: [1×1 projcrs]
Create a rectangular AOI from the polygon shape. Add a buffer of 300 meters around the AOI.
parksAOI = aoiquad(parks);
parksAOI = buffer(parksAOI,300);
Verify that the imagery and the AOI use the same type of coordinate system.
isequal(bostonR.CoordinateSystemType,parksAOI.CoordinateSystemType)
ans = logical
   1
Verify that the imagery and the AOI use the same projected CRS.
isequal(bostonR.ProjectedCRS,parksAOI.ProjectedCRS)
ans = logical
   1
Get the bounds of the AOI. Then, crop the imagery to the AOI.
[xlimits,ylimits] = bounds(parksAOI);
[bostonAcrop,bostonRcrop] = mapcrop(bostonA,bostonR,xlimits,ylimits);
Display the footprint of the cropped imagery over the footprint of the original imagery.
bostonFPcrop = aoiquad(bostonRcrop);
hold on
geoplot(bostonFPcrop)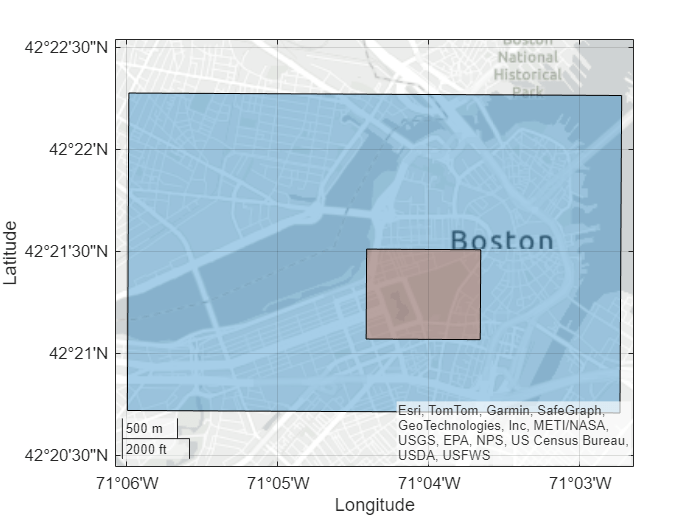
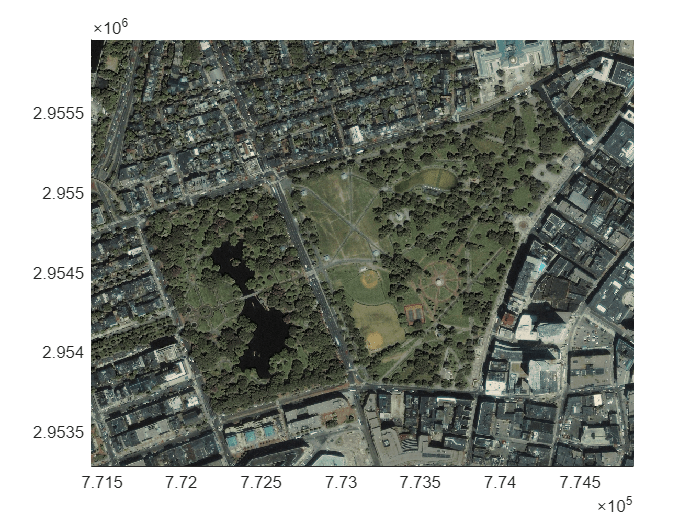
Using a new map, display the cropped imagery. Unlike geoplot, the mapshow function enables you to display projected raster data on a map. For more information about selecting a map display, see Choose a 2-D Map Display.
figure
mapshow(bostonAcrop,bostonRcrop)
See Also
Functions
aoiquad|aoicircle|readgeoraster|readgeotable|ginput