选择二维地图显示
Mapping Toolbox™ 提供了多种创建二维地图显示的选项。根据地图投影、数据类型和交互选项等标准选择地图显示方式。
| 目标示例 | 地图显示选项 | 示例地图 | 相关信息 |
|---|---|---|---|
投影
数据
交互性
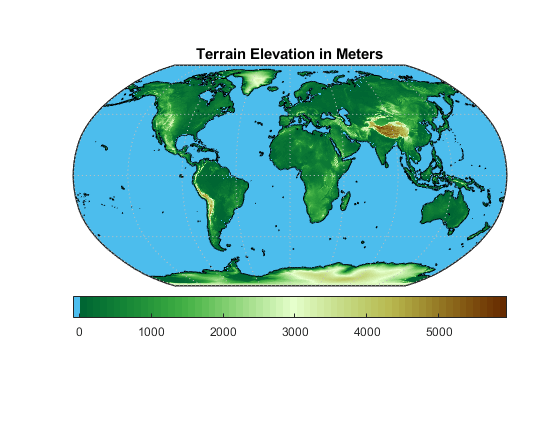
| 使用地图坐标区对象。 (自 R2023a 起)
|
| |
投影
数据
交互性
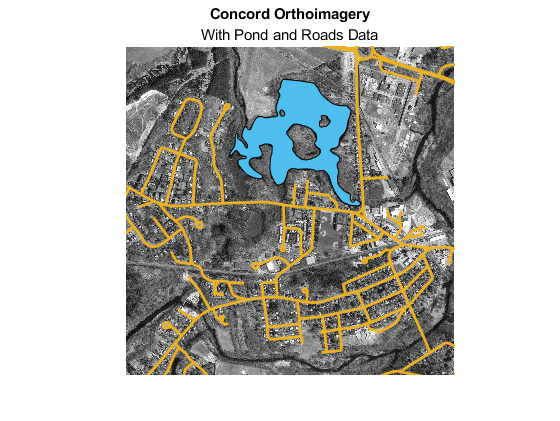
| 使用地理坐标区对象。
|
| |
投影
数据
| 使用基于
|
| |
投影
数据
交互性
| 使用一个坐标区对象。
|
|


Mapping Toolbox™ 提供了多种创建二维地图显示的选项。根据地图投影、数据类型和交互选项等标准选择地图显示方式。
| 目标示例 | 地图显示选项 | 示例地图 | 相关信息 |
|---|---|---|---|
投影
数据
交互性
| 使用地图坐标区对象。 (自 R2023a 起)
|
| |
投影
数据
交互性
| 使用地理坐标区对象。
|
| |
投影
数据
| 使用基于
|
| |
投影
数据
交互性
| 使用一个坐标区对象。
|
|