Create Common Plots over Basemap Images
When you create maps using geographic axes, you can provide context for your data by specifying a basemap. Geographic axes support several types of plots, including point, line, and polygon plots (geoplot), scatter plots (geoscatter), icon charts (geoiconchart), density plots (geodensityplot), and bubble plots (geobubble or bubblechart).
When geographic axes do not support a type of plot, you can read an image from a basemap by using the readBasemapImage function and then display both the image and the plot over an axes. This topic includes examples for displaying these types of plots over basemap images:
Digraphs
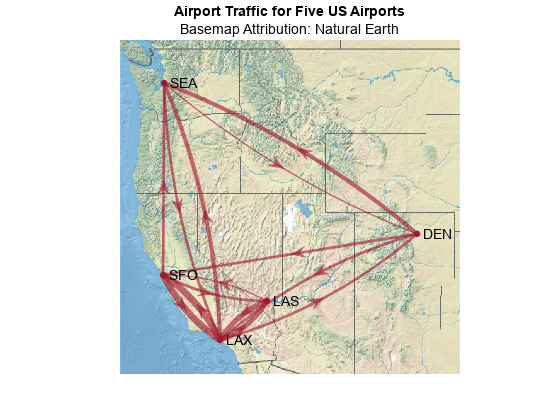
This example shows how to display a digraph of airport traffic over a basemap image.
Load Data
Specify the codes and geographic coordinates of five US airports.
code = ["DEN" "LAS" "LAX" "SEA" "SFO"];
lat = [39.8561 36.1699 33.9416 47.4502 37.6213];
lon = [-104.6737 -115.1398 -118.4085 -122.3088 -122.379];
Create a digraph from a table containing airport traffic data. Reorder the digraph nodes to match the order in code.
The
OriginandDesttable variables contain codes for the origin airports and destination airports.The
NumFlightsvariable table contains the number of flights between the origin and destination airport.
T = readtable("airport_traffic.xlsx");
G = digraph(T.Origin,T.Dest,T.NumFlights);
G = reordernodes(G,code);
Read Basemap Image
Specify latitude and longitude limits for the basemap image. Create a quadrangular area of interest (AOI) from the airport locations. Buffer the AOI by 3 degrees. Then, find the latitude and longitude limits of the buffered AOI.
aoi = aoiquad(lat,lon);
aoi = buffer(aoi,3);
[latlim,lonlim] = bounds(aoi);
Read an image for the region from the "landcover" basemap, using a zoom level of 5, as an array and a map cells reference object.
[A,RA] = readBasemapImage("landcover",latlim,lonlim,5);Project Data to Web Mercator Coordinates
The readBasemapImage function spatially references basemap images by using a Web Mercator (WGS 84 / Pseudo-Mercator) projected coordinate reference system (CRS). Project the airport locations from geographic coordinates to Web Mercator coordinates.
[x,y] = projfwd(RA.ProjectedCRS,lat,lon);
Display Data over Basemap Image
Display the basemap image on a map with no axis labels.
figure
mapshow(A,RA)
hold on
axis off
Display the digraph on the same map. Customize the digraph plot using these options:
Position the nodes by setting the x-data and y-data properties to the projected airport coordinates.
Use thicker edges for more heavily trafficked routes by setting the line width property.
Improve the visibility of the plot by setting the node font size, edge transparency, arrow size, edge color, and node color properties.
lineWidth = G.Edges.Weight/min(G.Edges.Weight);
plot(G,XData=x,YData=y,LineWidth=lineWidth, ...
    NodeFontSize=11,EdgeAlpha=0.6,ArrowSize=12, ...
    EdgeColor="#A2142F",NodeColor="#A2142F")
Add a title and subtitle.
title("Airport Traffic for Five US Airports")
subtitle("Basemap Attribution: Natural Earth")
Contours
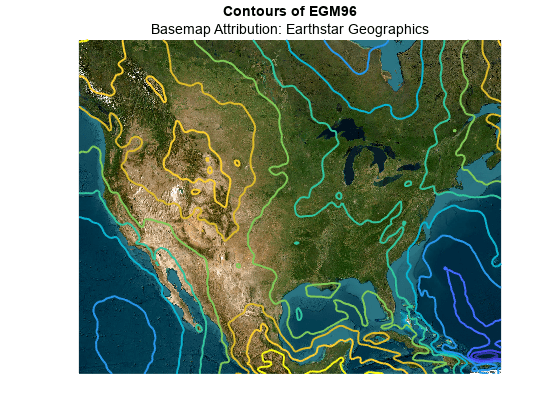
This example shows how to display contours of the Earth Gravitational Model of 1996 (EGM96) over a basemap image.
Load Data
Load geoid heights from EGM96 for a region containing the conterminous United States. The egm96geoid function returns geoid heights as an array and a geographic cells reference object in WGS 84 coordinates.
latlim = [17 56];
lonlim = [-128 -64];
[N,RN] = egm96geoid;
[N,RN] = geocrop(N,RN,latlim,lonlim);
To read spatially referenced raster data from a file, use the readgeoraster function.
Read Basemap Image
Read an image for the region from the "satellite" basemap as an array, a map cells reference object, and an attribution string.
[A,RA,attrib] = readBasemapImage("satellite",latlim,lonlim);Project Data to Web Mercator Coordinates
The readBasemapImage function spatially references basemap images by using a Web Mercator (WGS 84 / Pseudo-Mercator) projected CRS. To display the geoid heights over the basemap image, you must project the geographic coordinates to the projected CRS.
Extract the geographic coordinates of the geoid heights from the reference object. Then, project the geographic coordinates to Web Mercator coordinates.
[lat,lon] = geographicGrid(RN);
[x,y] = projfwd(RA.ProjectedCRS,lat,lon);
Display Data over Basemap Image
Display the basemap image on a map with no axis labels.
figure
mapshow(A,RA)
hold on
axis off
Display 10 contours of the geoid heights on the same map.
contour(x,y,N,10,LineWidth=1.5)
Add a title and subtitle.
title("Contours of EGM96")
subtitle("Basemap Attribution: " + attrib)
Images
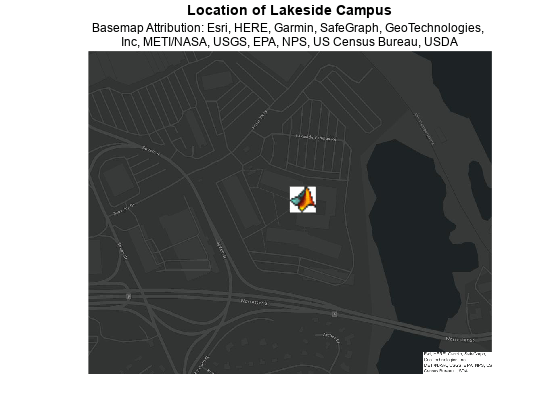
This example shows how to display a photograph taken on Berkeley Street in Boston, MA over a basemap image.
Read Basemap Image
Specify the latitude and longitude coordinates of the camera. Then, read an image of size 800-by-1000 from the "streets" basemap for a region centered on the camera. The readBasemapImage function returns the basemap image as an array, a map cells reference object, and an attribution string.
lat = 42.35009;
lon = -71.07244;
[A,RA,attrib] = readBasemapImage("streets",[lat lon],18,[800 1000]);
Load Photograph
Read the photograph as an RGB image of size 480-by-640-by-3 and a colormap. To ensure the photograph fits within the basemap image, decrease the size of the photograph.
P = imread(fullfile(matlabroot,"toolbox","matlab","demos","street1.jpg"));
P = imresize(P,0.6);
Spatially Reference Photograph
The readBasemapImage function spatially references basemap images by using a Web Mercator (WGS 84 / Pseudo-Mercator) projected CRS. Using the coordinates of the camera as the lower-left corner of the image, spatially reference the photograph to Web Mercator coordinates.
Project the latitude and longitude coordinates of the camera to Web Mercator coordinates.
[x,y] = projfwd(RA.ProjectedCRS,lat,lon);
Specify the xy-limits of the photograph using the projected coordinates, the size of the photograph, and the sizes of individual cells in the basemap image.
sz = size(P);
xlimits = [x (x + sz(2)*RA.CellExtentInWorldX)];
ylimits = [y (y + sz(1)*RA.CellExtentInWorldY)];
Spatially reference the photograph by creating a map cells reference object. Indicate that the first row of the photograph is the northmost row (as is common with images) by setting the ColumnsStartFrom property.
RP = maprefcells(xlimits,ylimits,sz,ColumnsStartFrom="north");Display Data over Basemap Image
Display the basemap image on a map with no axis labels.
figure
mapshow(A,RA)
hold on
axis off
Display the photograph and the location of the camera on the same map.
mapshow(P,RP)
mapshow(x,y,DisplayType="point",MarkerSize=7,Marker="o",MarkerFaceColor="r")
Add a title and subtitle. Wrap the basemap attribution text.
title("Image Over Basemap")

t = "Basemap Attribution: " + attrib;
t = string(textwrap(t,70));
subtitle(t,FontSize=9)
3-D Surfaces
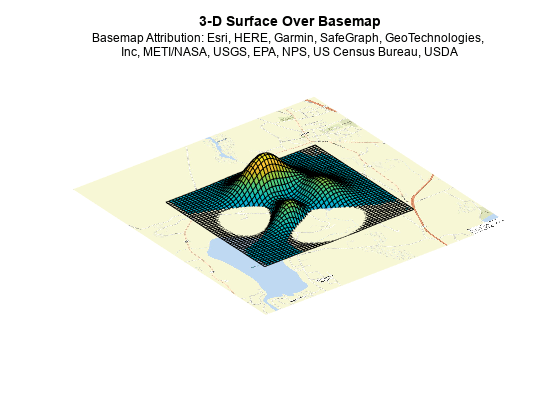
This example shows how to display a sample 3-D surface over a basemap image.
Load Data
Create a sample 3-D surface referenced to geographic coordinates. Generate the z-coordinates by using the peaks function. Reference the z-coordinates to a region in latitude-longitude coordinates by using the georefcells function.
Z = 100*peaks;
RZ = georefcells([42.3342 42.3561],[-73.3191 -73.2847],size(Z));
To read spatially referenced raster data from a file, use the readgeoraster function.
Read Basemap Image
Specify latitude and longitude limits for the basemap image by expanding the 2-D limits of the surface. For this example, expand the limits by 0.01 degrees.
aoi = aoiquad(RZ);
aoi = buffer(aoi,0.01);
[latlim,lonlim] = bounds(aoi);
Read an image from the "streets-light" basemap as an array, a map cells reference object, and an attribution string.
[A,RA,attrib] = readBasemapImage("streets-light",latlim,lonlim);Project Data to Web Mercator Coordinates
The readBasemapImage function spatially references basemap images by using a Web Mercator (WGS 84 / Pseudo-Mercator) projected CRS. To display the surface over the basemap image, you must project the geographic coordinates to the projected CRS.
Extract the geographic coordinates of the surface from the reference object. Then, project the geographic coordinates to Web Mercator coordinates.
[lat,lon] = geographicGrid(RZ);
[x,y] = projfwd(RA.ProjectedCRS,lat,lon);
Display Data over Basemap Image
Display the basemap image on a map with no axis labels.
figure
mapshow(A,RA)
hold on
axis off
Display the 3-D surface on the same map.
surf(x,y,Z)
view(3)
Add a title and subtitle. Wrap the basemap attribution text.
title("3-D Surface Over Basemap")

t = "Basemap Attribution: " + attrib;
t = string(textwrap(t,70));
subtitle(t,FontSize=9)