makesymbolspec
Create vector layer symbol specification
Description
symbolspec = makesymbolspec(
creates a symbol specification geometry,rule1,rule2,...,ruleN)symbolspec for the shape
geometry according to the rules specified in one or more
rule arguments.
Use symbol specifications to customize the appearance of vector shapes for maps you
create using the mapshow and geoshow functions.
Examples
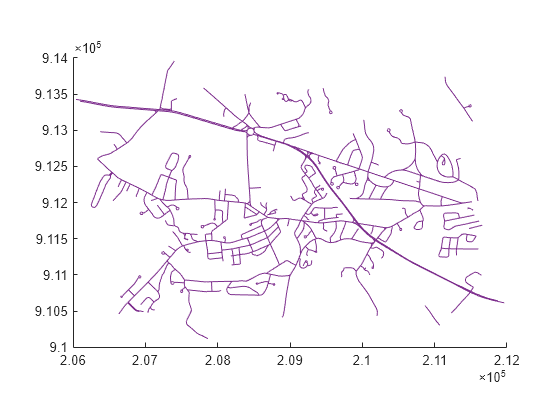
Import a shapefile containing road data for Concord, MA, as a geospatial table.
roads = readgeotable("concord_roads.shp");Create a symbol specification that specifies the default line color as purple.
blueRoads = makesymbolspec("Line",{'Default','Color','#7E2F8E'});
Display the roads using the symbol specification.
mapshow(roads,"SymbolSpec",blueRoads)
Import a shapefile containing road data for Concord, MA, as a geospatial table.
roads = readgeotable("concord_roads.shp");The CLASS attribute includes information about road types. For example, a value of 2 indicates a multilane highway and a value of 6 indicates a minor road. Create a symbol specification that specifies road colors based on the value of CLASS.
roadColors = makesymbolspec("Line", ...
    {'CLASS',2,'Color','#A2142F'}, ...
    {'CLASS',3,'Color','#77AC30'}, ...
    {'CLASS',6,'Color','#0072BD'}, ...
    {'Default','Color','k'});
Display the roads using the symbol specification.
mapshow(roads,"SymbolSpec",roadColors)
Import a shapefile containing road data for Concord, MA, as a geospatial table.
roads = readgeotable("concord_roads.shp");The CLASS attribute includes information about road types. For example, a value of 2 indicates a multilane highway and a value of 6 indicates a minor road. Create a symbol specification that specifies line styles and widths based on the value of CLASS such that major roads have a thick dashed lines and minor roads have thin dash-dotted lines.
lineStyles = makesymbolspec("Line", ...
    {'CLASS',[1 3],'LineStyle',':','LineWidth',2}, ...
    {'CLASS',[4 6],'LineStyle','-.','LineWidth',0.25});
Display the roads using the symbol specification.
mapshow(roads,"SymbolSpec",lineStyles)
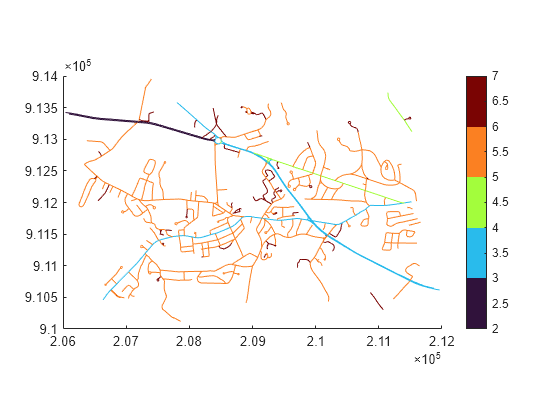
Import a shapefile containing road data for Concord, MA, as a geospatial table.
roads = readgeotable("concord_roads.shp");The CLASS attribute includes information about road types. For example, a value of 2 indicates a multilane highway, a value of 3 indicates a major road, and a value of 6 indicates a minor road. Create a symbol specification that specifies line colors in the turbo colormap based on the value of CLASS so that highways are blue, major roads are green, and minor roads are red.
cmap = turbo(5);
colorRange = makesymbolspec("Line", ...
    {'CLASS',[2 6],'Color',cmap});
Display the roads using the symbol specification.
mapshow(roads,"SymbolSpec",colorRange)Add a colorbar to the map by setting the colormap and colormap limits of the axes.
colormap(cmap)
clim([2 7])
colorbar

Input Arguments
Shape type, specified as one of these options:
"Point"— Point shape"Line"— Line shape"PolyLine"— Series of connected line shapes"Polygon"— Polygon shape"Patch"— Patch shape
Data Types: char | string
Shape customization rule, specified as a cell array.
To create a default rule for all features with the specified
geometry, specify rule using this
pattern:
{'Default',Property1,Value1,Property2,Value2,...,PropertyN,ValueN},
where Property1, Property2, and
PropertyN are graphics properties and Value1,
Value2, and ValueN are values. Specify
properties using character vectors. Valid properties depend on the value of
geometry:
"Point"— Valid properties areMarker,Color,MarkerEdgeColor,MarkerFaceColor,MarkerSize, andVisible. For a description of each property, see Line Properties."Line"and"PolyLine"— Valid properties areColor,LineStyle,LineWidth, andVisible. For a description of each property, see Line Properties."Polygon"and"Patch"— Valid properties areFaceColor,FaceAlpha,LineStyle,LineWidth,EdgeColor, andEdgeAlpha, andVisible. For a description of each property, see Patch Properties.
To create a rule based on the values of an attribute, specify
rule using this pattern:
{AttributeName,AttributeValue,Property1,Value1,Property2,Value2,...,PropertyN,ValueN},
where AttributeName is the attribute and
AttributeValue is the value or range of values. The size of
AttributeValue and Value1,
Value2, and ValueN do not need to match.
When a feature does not match a rule, the mapshow and
geoshow functions display the feature using default graphics
properties.
Data Types: cell
Version History
Introduced before R2006a
MATLAB Command
You clicked a link that corresponds to this MATLAB command:
Run the command by entering it in the MATLAB Command Window. Web browsers do not support MATLAB commands.
选择网站
选择网站以获取翻译的可用内容,以及查看当地活动和优惠。根据您的位置,我们建议您选择:。
您也可以从以下列表中选择网站:
如何获得最佳网站性能
选择中国网站(中文或英文)以获得最佳网站性能。其他 MathWorks 国家/地区网站并未针对您所在位置的访问进行优化。
美洲
- América Latina (Español)
- Canada (English)
- United States (English)
欧洲
- Belgium (English)
- Denmark (English)
- Deutschland (Deutsch)
- España (Español)
- Finland (English)
- France (Français)
- Ireland (English)
- Italia (Italiano)
- Luxembourg (English)
- Netherlands (English)
- Norway (English)
- Österreich (Deutsch)
- Portugal (English)
- Sweden (English)
- Switzerland
- United Kingdom (English)