主要内容

本页采用了机器翻译。点击此处可查看英文原文。

geographicGrid

栅格元素的地理坐标

自 R2021a 起

说明

[lat,lon] = geographicGrid(R) 将栅格元素的地理坐标返回为二维数组 latlon。栅格元素 (i,j) 的坐标为 (lat(i,j),lon(i,j))

示例

[lat,lon] = geographicGrid(R,gridOption),其中 gridOption'gridvectors',返回 latlon 作为向量。栅格元素 (i,j) 的坐标为 (lat(i),lon(j))gridOption 的默认值为 'fullgrid',其返回值为二维数组 latlon

示例

示例

全部折叠

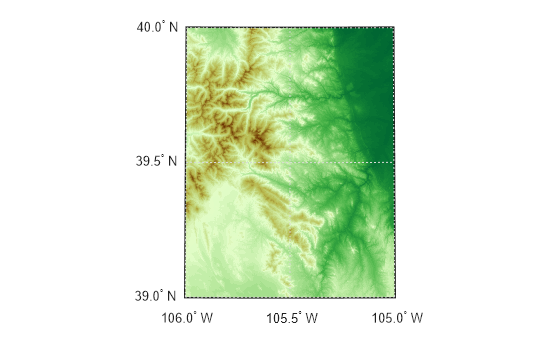
导入科罗拉多州南博尔德峰周边区域的高程数据 [1],作为数组和地理发布参考对象。获取数组中每个元素的坐标。

[Z,R] = readgeoraster('n39_w106_3arc_v2.dt1');
[lat,lon] = geographicGrid(R);

创建一张地图,其纬度和经度范围与数据范围相匹配。使用适当的颜色图显示数据。

usamap(R.LatitudeLimits,R.LongitudeLimits)
surfm(lat,lon,Z)
demcmap(Z)

Figure contains an axes object. The hidden axes object contains 10 objects of type patch, surface, line, text.

[1] The elevation data used in this example is courtesy of the U.S. Geological Survey.

创建一个地理单元参考对象,用于表示一个 3×4 的栅格,其纬度值范围为 [0, 30] 度,经度值范围为 [-20, 20] 度。获取栅格元素的坐标,并将其作为行向量返回。

R = georefcells([0 30],[-20 20],[3 4]);
[lat,lon] = geographicGrid(R,'gridvectors')
lat = 1×3

     5    15    25

lon = 1×4

   -15    -5     5    15

若未将第二个参数指定为 'gridvectors',则 geographicGrid 函数默认返回二维数组。

[latFull,lonFull] = geographicGrid(R)
latFull = 3×4

     5     5     5     5
    15    15    15    15
    25    25    25    25

lonFull = 3×4

   -15    -5     5    15
   -15    -5     5    15
   -15    -5     5    15

输入参数

全部折叠

空间参考,指定为 GeographicCellsReferenceGeographicPostingsReference 对象。

RGeographicCellsReference 对象,则 latlon 均为单元中心。如果 RGeographicPostingsReference 对象,则 latlon 是发布点。

网格选项,指定为以下值之一:

  • 'fullgrid' - 将 latlon 作为二维数组返回,其中 lat 的每列相同,lon 的每行相同。这是默认行为。

  • 'gridvectors' - 将 latlon 作为行向量返回。当您希望减少内存使用且无需二维数组时,请使用此选项,例如使用 surfm 函数绘制大型数据集时。

此表显示了 'fullgrid''gridvectors' 之间的差异。

'fullgrid''gridvectors'
R = georefcells([0 30],[-20 20],[3 4]);
[lat,lon] = geographicGrid(R)
lat =

     5     5     5     5
    15    15    15    15
    25    25    25    25


lon =

   -15    -5     5    15
   -15    -5     5    15
   -15    -5     5    15
R = georefcells([0 30],[-20 20],[3 4]);
[lat,lon] = geographicGrid(R,'gridvectors')
lat =

     5    15    25


lon =

   -15    -5     5    15

数据类型: char | string

输出参量

全部折叠

纬度,以二维数组或行向量形式返回。默认情况下,lat 是二维数组。要将 lat 作为行向量返回,请将 gridOption 指定为 'gridvectors'

默认情况下,当 gridOption'fullgrid' 时,latlon 的大小各等于 RRasterSize 属性。当 gridOption 等于 'gridvectors' 时,latlon 的长度分别等于 RRasterSize 属性的第一个和第二个元素。

经度,以二维数组或行向量形式返回。默认情况下,lon 是二维数组。要将 lon 作为行向量返回,请将 gridOption 指定为 'gridvectors'

默认情况下,当 gridOption'fullgrid' 时,latlon 的大小各等于 RRasterSize 属性。当 gridOption 等于 'gridvectors' 时,latlon 的长度分别等于 RRasterSize 属性的第一个和第二个元素。

版本历史记录

在 R2021a 中推出