surflsrm
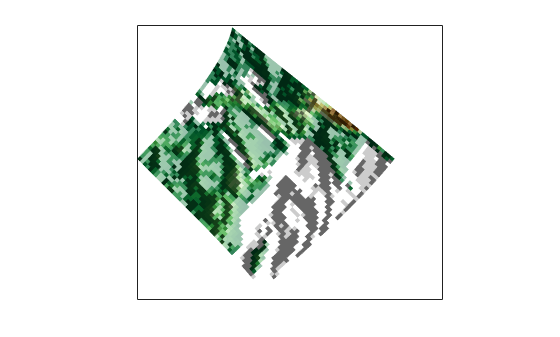
3-D lighted shaded relief of geolocated data grid on axesm-based map
Syntax
surflsrm(lat,long,Z)

surflsrm(lat,long,Z,[azim elev])

surflsrm(lat,long,Z,[azim elev],cmap)

surflsrm(lat,long,Z,[azim elev],cmap,clim)

h = surflsrm(...)
Description
surflsrm(lat,long,Z) displays
the geolocated data grid, colored according to elevation and surface
slopes. The current axes must have a valid map projection definition.
surflsrm(lat,long,Z,[azim elev]) displays
the geolocated data grid with the light coming from the specified
azimuth and elevation. Lighting is applied before the data is projected.
Angles are in degrees, with the azimuth measured clockwise from North,
and elevation up from the zero plane of the surface. By default, the
direction of the light source is east (90º azimuth) at an elevation
of 45º.
surflsrm(lat,long,Z,[azim elev],cmap) displays
the geolocated data grid using the provided colormap. The number of
grayscales is chosen to keep the size of the shaded colormap below
256. By default, the colormap is constructed from 16 colors and 16
grays. If the vector of azimuth and elevation is empty, the default
locations are used.
surflsrm(lat,long,Z,[azim elev],cmap,clim) uses
the provided color axis limits, which are, by default, automatically
computed from the data.
h = surflsrm(...) returns
the handle to the surface drawn.
Examples
Tips
This function effectively multiplies two colormaps, one with color based on elevation, the other with a grayscale based on the slope of the surface, to create a new colormap. This produces an effect similar to using a light on a surface, but with all of the visible colors actually in the colormap. Lighting calculations are performed on the unprojected data.
Version History
Introduced before R2006a
