Adjust Transparency of Geographic Density Plots
This example shows how to adjust the transparency of geographic density plots. In general, you can control the transparency of a density plot by changing the alphamap, the alpha limits, or the alpha scale.
The alphamap defines the transparency of the density plot. By default, an alphamap is a vector of 64 values that ranges linearly from 0 to 1. Alpha values of 0 are completely transparent, alpha values of 1 are completely opaque, and alpha values between 0 and 1 are semitransparent. MATLAB® displays the density plot by mapping density values to alpha values in the alphamap. You can view or modify the alphamap by using the
alphamapfunction.The alpha limits control how MATLAB maps density values to alpha values in the alphamap. All density values that are less than or equal to the minimum limit map to the first value in the alphamap. All density values that are greater than or equal to the maximum limit map to the last value in the alphamap. All density values between the minimum and maximum limits map to the intermediate values in the alphamap. You can view or modify the alpha limits by using the
alimfunction.The alpha scale also controls how MATLAB maps density values to alpha values in the alphamap. By default, the alpha scale is linear. You can change the alpha scale to logarithmic by setting the
AlphaScaleproperty of the geographic axes object to"log".
This example shows how to use the alphamap, alpha limits, and alpha scale to:
Increase the opacity of low densities
Emphasize high densities
Emphasize middle densities
Reverse the transparency of high and low densities
Show areas with nonzero density
Load and View Data
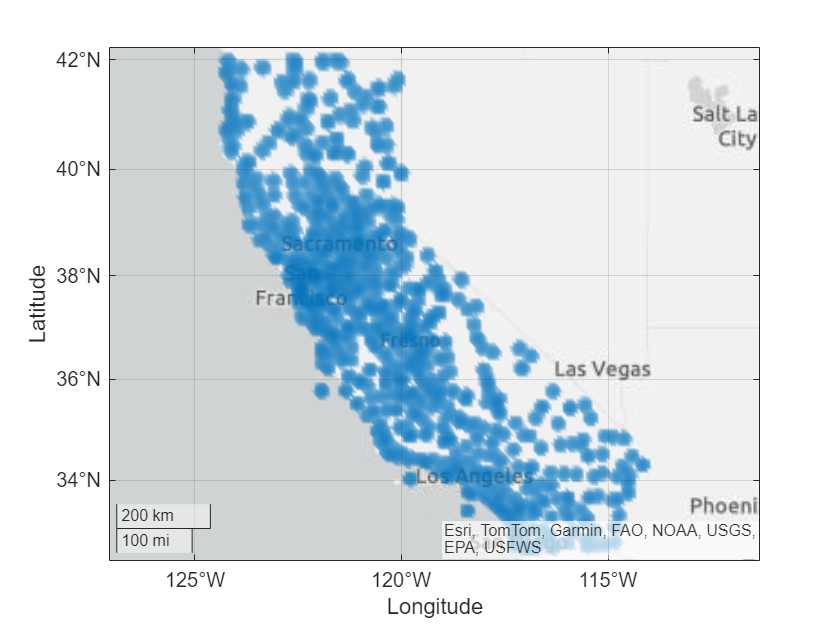
Create a density plot using the default transparency.
Load a table containing cell tower data for California. Each table row represents a cell tower. The table variables include data about the cell towers, such as the latitude and longitude coordinates. Extract the latitude and longitude coordinates from the table.
load cellularTowers.mat

lat = cellularTowers.Latitude;
lon = cellularTowers.Longitude;
Create a density plot from the latitude and longitude coordinates. Specify the radius of influence for each point as 50 km.
figure
geodensityplot(lat,lon,Radius=50e3)
Increase Opacity of Low Densities
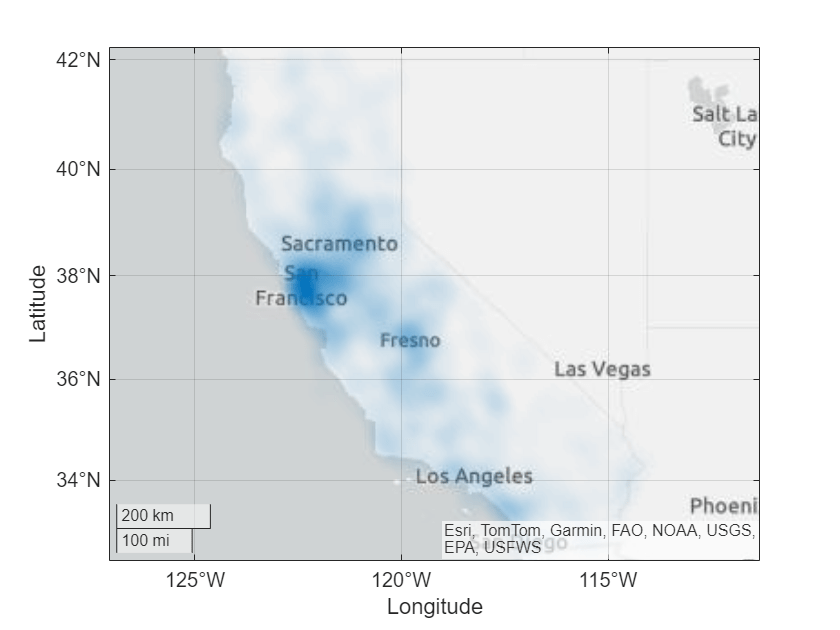
Increase the opacity of low densities by changing the alphamap.
Create a new density plot from the latitude and longitude coordinates.
figure
geodensityplot(lat,lon,Radius=50e3)
By default, the alphamap ranges linearly from 0 to 1. Create an alphamap that ranges according to a square root operation by using these steps:
Create a linearly-spaced vector with elements ranging from 1 to 64.
Calculate the square root of each element.
Transform the vector into a valid alphamap by rescaling the vector to the interval [0, 1].
v = 1:64;
sqrtv = sqrt(v);
amap = rescale(sqrtv);
Apply the new alphamap to the figure. Compared to the default alphamap, the square root alphamap uses larger values for alphamap elements that are associated with lower densities.
alphamap(amap)
Emphasize High Densities
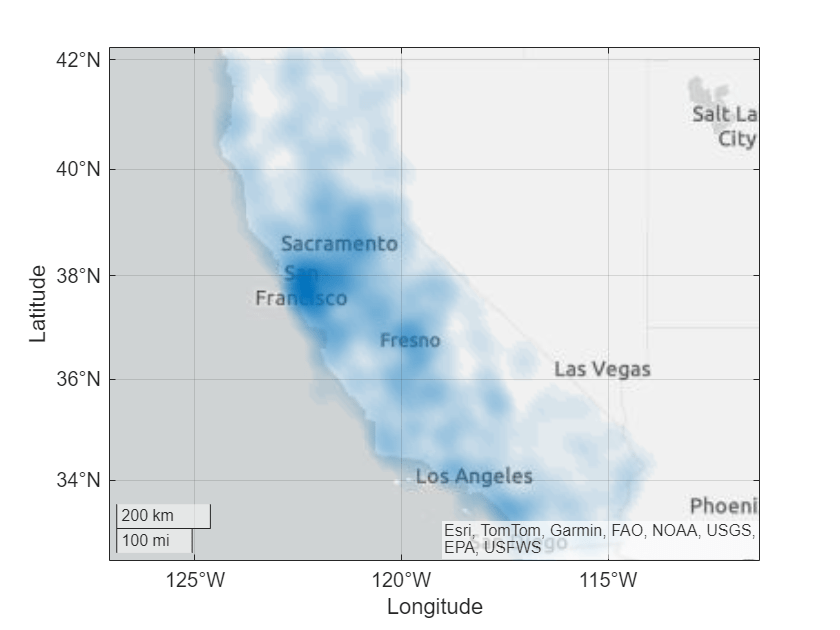
Emphasize high densities by decreasing the upper alpha limit.
Create a new density plot from the latitude and longitude coordinates.
figure
geodensityplot(lat,lon,Radius=50e3)
Get the current alpha limits of the density plot. Then, multiply the upper limit by a value between 0 and 1.
alimits = alim;
multiplier = 0.5;
alimits(2) = alimits(2) * multiplier;
0.5;
alimits(2) = alimits(2) * multiplier;Apply the new alpha limits to the figure. Densities that are greater than the new upper alpha limit appear fully opaque.
alim(alimits)
Emphasize Middle Densities
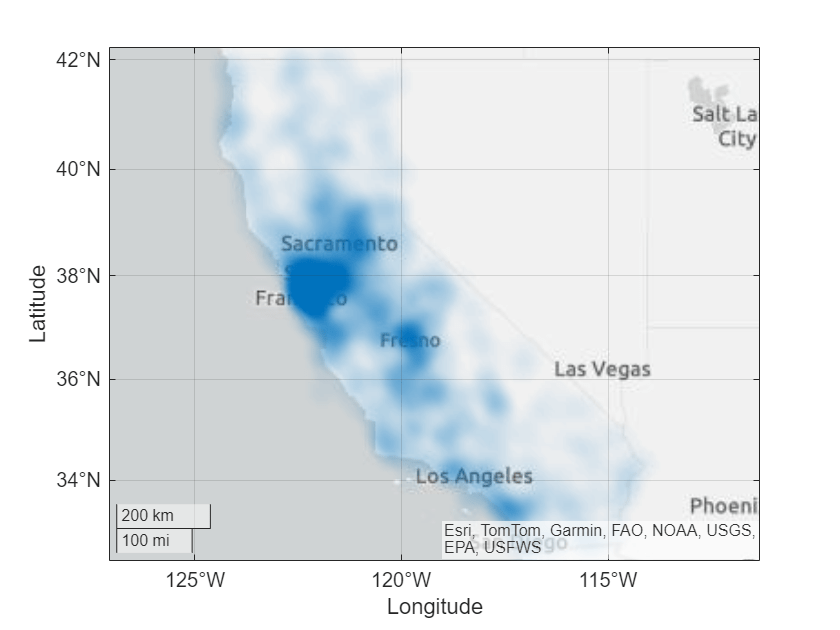
Emphasize middle densities by changing the alphamap.
Create a new density plot from the latitude and longitude coordinates.
figure
geodensityplot(lat,lon,Radius=50e3)
Apply the vup alphamap. This alphamap uses an alpha value of 1 for the middle density, so that the middle densities are more opaque. As the densities decrease or increase from the middle density, the alpha values decrease to 0, so that the low and high densities are more transparent.
alphamap vup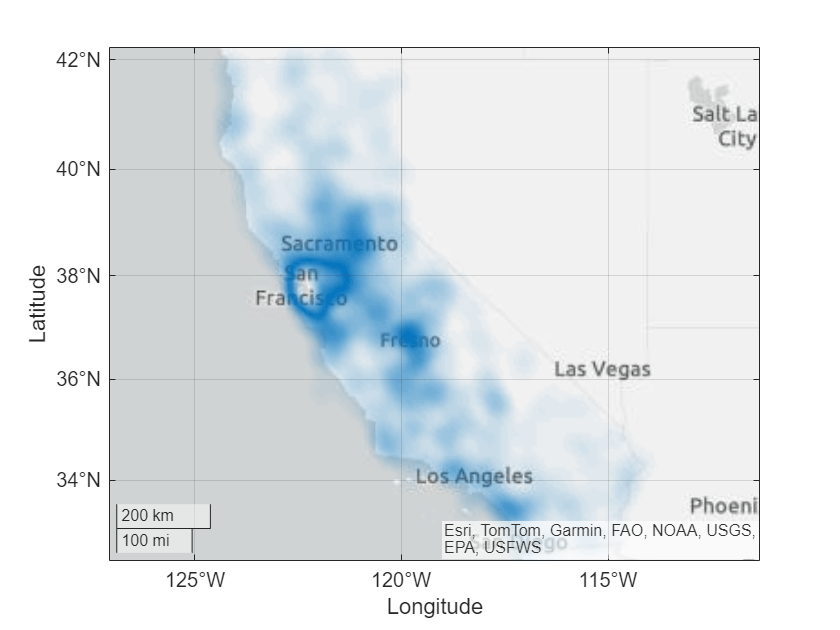
Reverse Transparency of High and Low Densities
Reverse the transparency of high and low densities by changing the alphamap. This strategy is useful when you want to view the basemap under the high densities.
Create a new density plot from the latitude and longitude coordinates.
figure
geodensityplot(lat,lon,Radius=50e3)
Apply the rampdown alphamap. This alphamap uses an alpha value of 1 for the minimum density, so the areas with no density are opaque. As the densities increase, the alpha values decrease to 0, so that the low and middle densities are more transparent.
alphamap rampdown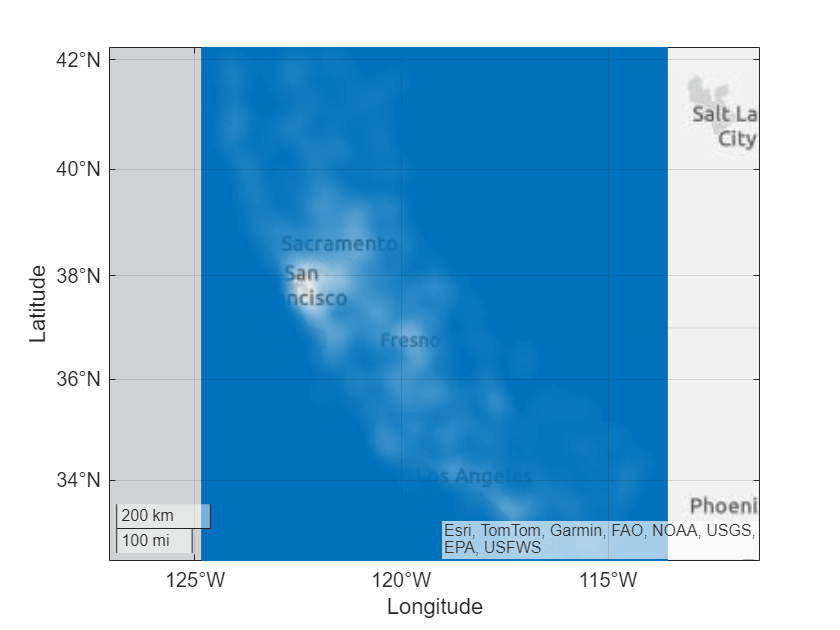
Note that a density plot is a surface with varying transparency. The density plot looks like a rectangle because the densities outside the specified coordinates are undefined.
Show Areas with Nonzero Density
Density plots typically emphasize the highest densities. You can show the areas with nonzero density by changing the alpha scale to logarithmic.
Create a new density plot from the latitude and longitude coordinates. For this density plot, enable MATLAB to automatically select a radius of influence by omitting the Radius name-value argument.
figure
geodensityplot(lat,lon)
Assign the current geographic axes to a variable. Then, change the alpha scale of the axes to logarithmic.
gx = gca;
gx.AlphaScale = "log";