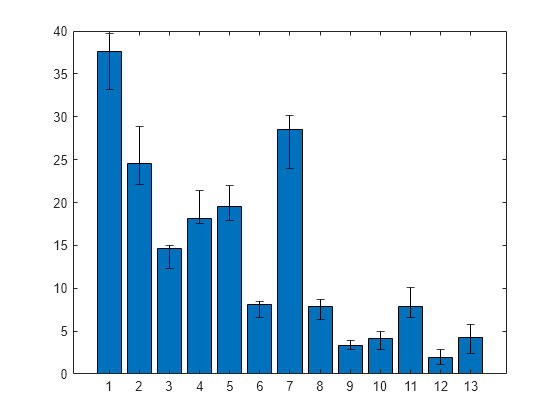
带有误差条的条形图
结合使用 bar 和 errorbar 函数创建带有误差条的条形图。
x = 1:13;
data = [37.6 24.5 14.6 18.1 19.5 8.1 28.5 7.9 3.3 4.1 7.9 1.9 4.3]';
errhigh = [2.1 4.4 0.4 3.3 2.5 0.4 1.6 0.8 0.6 0.8 2.2 0.9 1.5];
errlow  = [4.4 2.4 2.3 0.5 1.6 1.5 4.5 1.5 0.4 1.2 1.3 0.8 1.9];

bar(x,data)

hold on

er = errorbar(x,data,errlow,errhigh);
er.Color = [0 0 0];
er.LineStyle = 'none';

hold off