bar
条形图

语法
说明
向量和矩阵数据
表数据
其他选项
bar(___, 使用一个或多个名称-值对组参量指定条形图的属性。仅使用默认 Name,Value)'grouped' 或 'stacked' 样式的条形图支持设置条形属性。在所有其他输入参量之后指定名称-值对组参量。有关属性列表,请参阅 Bar 属性。
示例
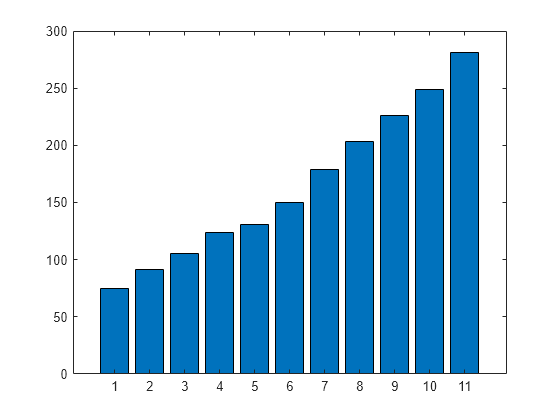
y = [75 91 105 123.5 131 150 179 203 226 249 281.5];
bar(y)
指定沿 x 轴的条形位置。
x = 1900:10:2000;
y = [75 91 105 123.5 131 150 179 203 226 249 281.5];
bar(x,y)

自 R2023b 起
创建一个包含四个条形名称的字符串向量 x。创建一个包含条形长度的数值向量 y。然后创建一个 x 和 y 的条形图。
x = ["Spring" "Summer" "Autumn" "Winter"];
y = [1 2 3 4];
bar(x,y)

将各条形的宽度设置为各条形可用总空间的 40%。
y = [75 91 105 123.5 131 150 179 203 226 249 281.5];
bar(y,0.4)

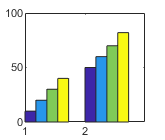
显示四个条形组,每一组包含三个条形。
y = [2 2 3; 2 5 6; 2 8 9; 2 11 12];
bar(y)

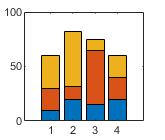
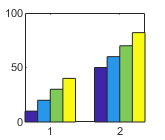
为矩阵中的每一行显示一个条形。每个条形的高度是行中各元素之和。
y = [2 2 3; 2 5 6; 2 8 9; 2 11 12];
bar(y,'stacked')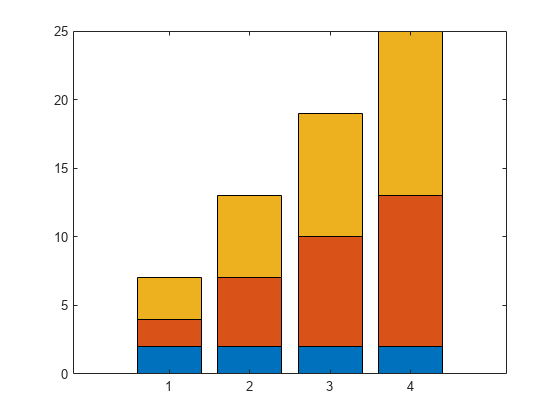
创建一个标量 x 和一个向量 y。以 x=2020 为中心显示一个堆叠条形图。堆叠中的每个分块对应于 y 的一个元素。
 x = 2020;
 y = [30 50 23];
 b = bar(x,y,"stacked");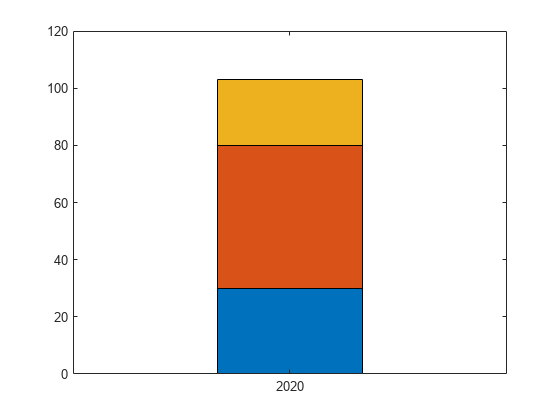
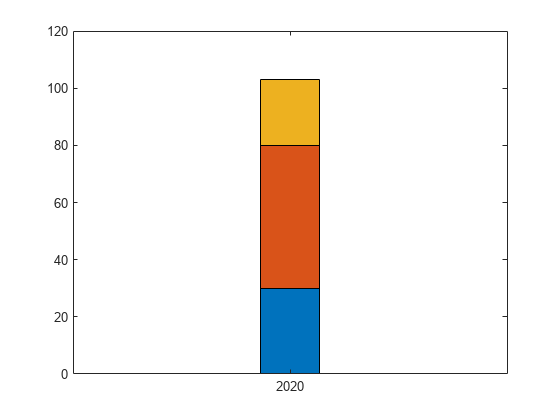
调整堆叠条形图的宽度。由于各个条形是堆叠的,因此更改 Bar 对象的宽度会更改所有条形。
b(1).BarWidth = 0.25;
将 x 定义为一个包含三个年份值的向量。将 y 定义为包含负值和正值组合的矩阵。在条形图中显示这些值。
x = [1980 1990 2000];
y = [15 20 -5; 10 -17 21; -10 5 15];
bar(x,y,'stacked')
指示条形图类别的一种方法是将 X 指定为分类数组。bar 函数使用经过排序的类别列表,因此条形的显示顺序可能与您预期的有所不同。要保留顺序,请调用 reordercats 函数。
将 X 定义为分类数组,并调用 reordercats 函数来指定条形的顺序。然后将 Y 定义为条形高度向量,并显示条形图。
X = categorical({'Small','Medium','Large','Extra Large'});
X = reordercats(X,{'Small','Medium','Large','Extra Large'});
Y = [10 21 33 52];
bar(X,Y)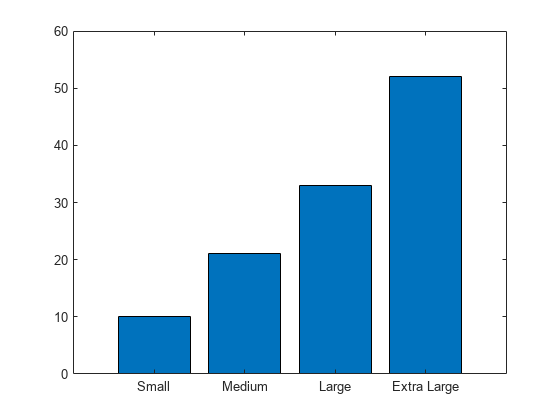
自 R2026a 起
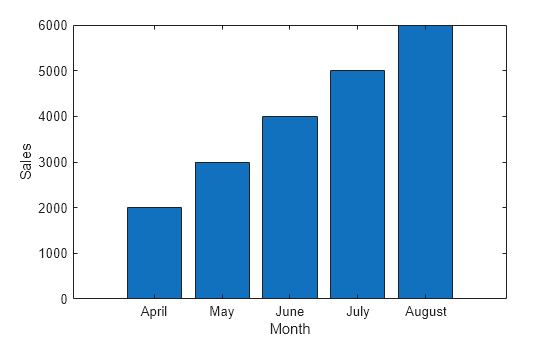
从小型季节性企业的销售额和收入数据创建一个表。绘制每个月的销售额。
Month = ["April"; "May"; "June"; "July"; "August"];
Sales = [2000; 3000; 4000; 5000; 6000];
Revenue = [1500; 1800; 2000; 3000; 4000];
tbl = table(Month, Sales, Revenue);
bar(tbl,"Month","Sales")
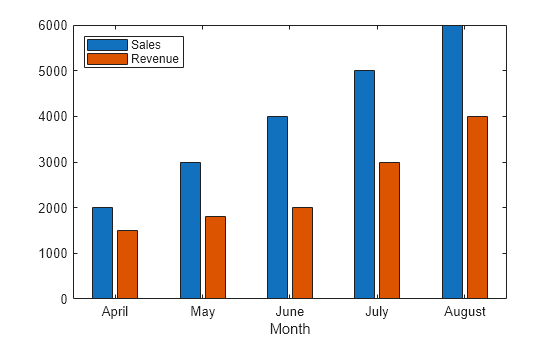
将销售额和收入数据与图例一起绘制。
figure
bar(tbl,"Month",["Sales","Revenue"])
legend(Location="northwest")
自 R2024b 起
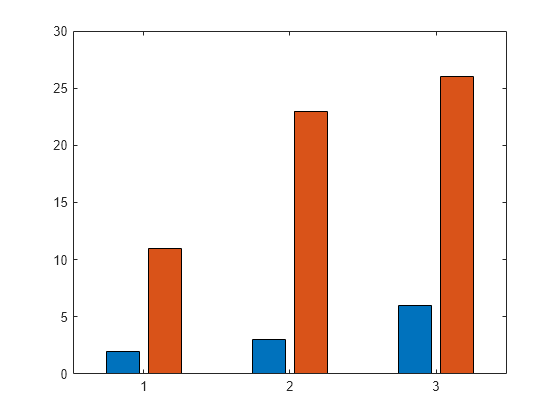
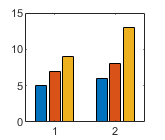
创建一个包含两个数据集值的矩阵 vals。在条形图中显示值,并指定输出参量。由于有两个数据集,bar 返回由两个 Bar 对象组成的向量。
x = [1 2 3];
vals = [2 3 6; 11 23 26];
b = bar(x,vals);

在第一个条形序列的末端显示存储在 YData 属性中的高度值。
b(1).Labels = b(1).YData;
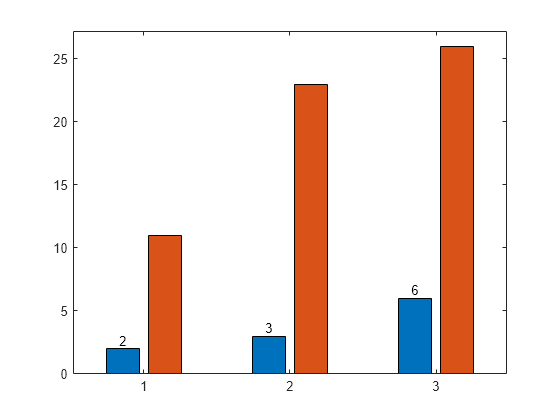
然后以同样的方式对第二个条形序列添加标签。
b(2).Labels = b(2).YData;

作为使用 Labels 属性指定条形标签的替代方法,您可以使用 text 函数来创建标签,并使用 XEndPoints 和 YEndPoints 属性来定位它们。
创建一个包含两个数据集值的矩阵 vals。在条形图中显示值,并指定输出参量。由于有两个数据集,bar 返回由两个 Bar 对象组成的向量。
x = [1 2 3];
vals = [2 3 6; 11 23 26];
b = bar(x,vals);
在第一个条形序列的末端显示高度值。通过获取第一个 Bar 对象的 XEndPoints 和 YEndPoints 属性,获取条形末端的坐标。将这些坐标传递给 text 函数,并指定垂直和水平对齐方式,让值显示在条形末端上方居中处。
xtips1 = b(1).XEndPoints;
ytips1 = b(1).YEndPoints;
labels1 = string(b(1).YData);
text(xtips1,ytips1,labels1,'HorizontalAlignment','center',...
    'VerticalAlignment','bottom')

接下来,在第二个条形序列的末端上方显示值。
xtips2 = b(2).XEndPoints;
ytips2 = b(2).YEndPoints;
labels2 = string(b(2).YData);
text(xtips2,ytips2,labels2,'HorizontalAlignment','center',...
    'VerticalAlignment','bottom')

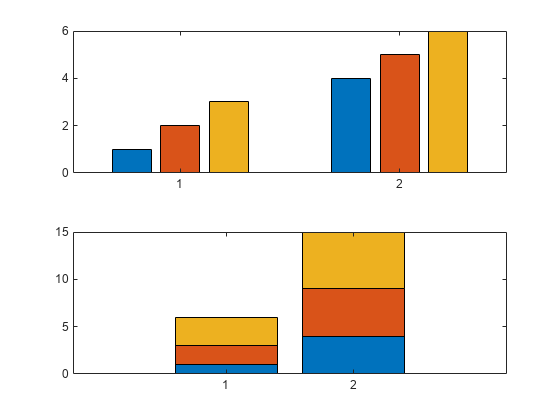
您可以使用 tiledlayout 和 nexttile 函数显示分块条形图。调用 tiledlayout 函数以创建一个 2×1 分块图布局。调用 nexttile 函数以创建坐标区对象 ax1 和 ax2。在顶部坐标区中显示条形图。在底部坐标区中,显示相同数据的堆叠条形图。
y = [1 2 3; 4 5 6];
tiledlayout(2,1)

% Top bar graph
ax1 = nexttile;
bar(ax1,y)

% Bottom bar graph
ax2 = nexttile;
bar(ax2,y,'stacked')
使用红色条形创建一个条形图。
y = [75 91 105 123.5 131 150 179 203 226 249 281.5];
bar(y,'r')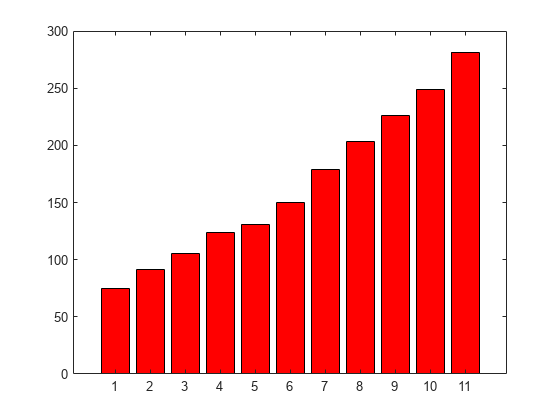
使用 RGB 三元组设置条形内部颜色和轮廓颜色。设置条形轮廓的宽度。
y = [75 91 105 123.5 131 150 179 203 226 249 281.5];
bar(y,'FaceColor',[0 .5 .5],'EdgeColor',[0 .9 .9],'LineWidth',1.5)

可以使用 Bar 对象的 CData 属性控制单个条形的颜色。
创建一个条形图并将 Bar 对象赋给一个变量。将 Bar 对象的 FaceColor 属性设置为 'flat',从而使条形图使用 CData 属性中定义的颜色。默认情况下,CData 属性预先填充由默认 RGB 颜色值组成的矩阵。要更改特定的颜色,请更改矩阵中的对应行。例如,更改第二个条形的颜色。
b = bar(rand(10,1));
b.FaceColor = 'flat';
b.CData(2,:) = [.5 0 .5];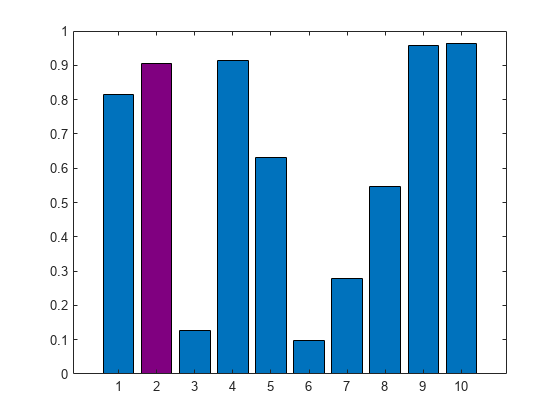
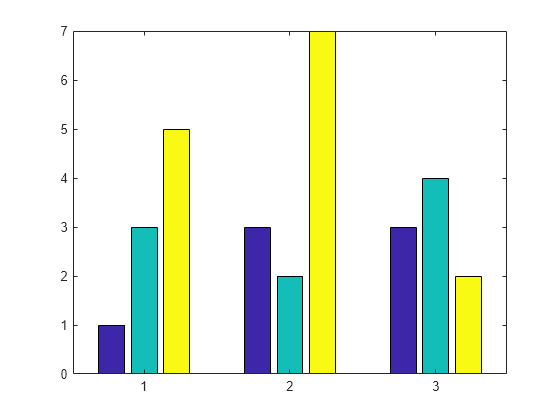
通过将 FaceColor 属性设置为 'flat',创建一个使用颜色图颜色的条形图。然后将每个 Bar 对象的 CData 属性设置为一个整数。
y = [1 3 5; 3 2 7; 3 4 2];
b = bar(y,'FaceColor','flat');
for k = 1:size(y,2)
    b(k).CData = k;
end
自 R2023b 起
使用命名的调色板可以方便地更改图的颜色。此示例使用三种不同的调色板来对条形图进行比较。
使用默认调色板创建一个随机数的条形图。
bar(rand(3,5))

使用 colororder 函数将调色板更改为 reef。
colororder("reef")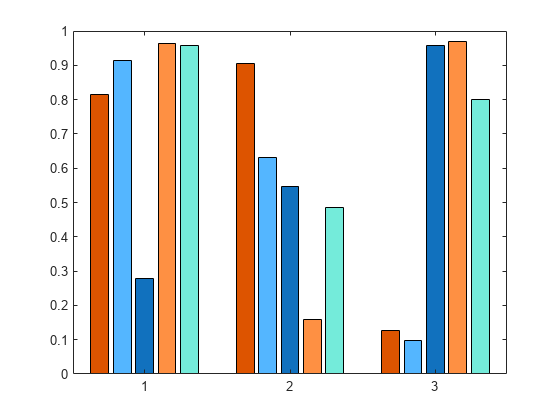
将调色板更改为 earth。
colororder("earth")
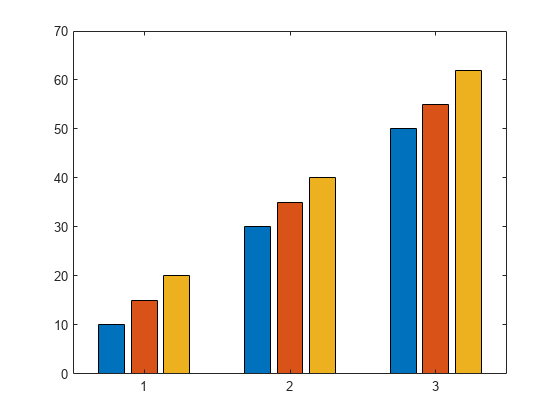
创建矩阵 y,其中每列为一个数据序列。调用 bar 函数以在条形图中显示数据,并指定输出参量。输出是包含三个 Bar 对象的向量,其中每个对象对应一个不同序列。无论条形是分组还是堆叠,均为如此。
y = [10 15 20; 30 35 40; 50 55 62];
b = bar(y);
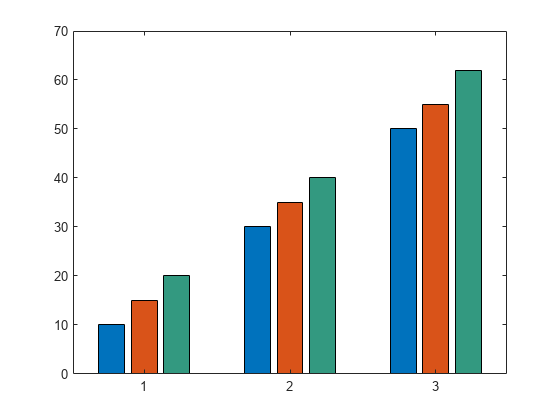
将第三个条形序列设置为绿色。
b(3).FaceColor = [.2 .6 .5];
输入参数
x 坐标,指定为标量、向量、矩阵、字符串数组或字符向量元胞数组。x 的值不需要按顺序排列。
如果将 x 指定为字符串数组或字符向量元胞数组,则值必须唯一。MATLAB® 将值存储为分类数组,条形按指定的顺序显示。
下表描述一些常见的数据呈现方式。
| 表示形式 | 如何指定 X 和 Y | 示例 |
|---|---|---|
| 显示一个条形序列。 | 指定 |
x = [1980 1990 2000];
y = [10 20 30];
bar(x,y)
|
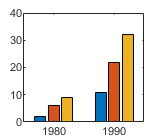
| 分组显示多个条形序列。 | 指定以下任意一种组合:
| x = [1980 1980 1980
1990 1990 1990];
y = [2 6 9
11 22 32];
bar(x,y)x = [1980 1990];
y = [2 6 9
11 22 32];
bar(x,y)
|
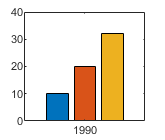
显示以一个 x 值为中心的一组条形。 | 指定 |
x = 1990;
y = [10 20 30];
bar(x,y)
|

数据类型: single | double | int8 | int16 | int32 | int64 | uint8 | uint16 | uint32 | uint64 | categorical | datetime | duration | string (自 R2023b 起) | cell (自 R2023b 起)
y 坐标,指定为标量、向量或矩阵。下表描述一些常见的数据呈现方式。
| 表示形式 | 如何指定 X 和 Y | 示例 |
|---|---|---|
| 显示一个条形序列。 | 指定 |
x = [1980 1990 2000];
y = [10 20 30];
bar(x,y)
|
| 分组显示多个条形序列。 | 指定以下任意一种组合:
| x = [1980 1980 1980
1990 1990 1990];
y = [2 6 9
11 22 32];
bar(x,y)x = [1980 1990];
y = [2 6 9
11 22 32];
bar(x,y)
|
显示以一个 x 值为中心的一组条形。 | 指定 |
x = 1990;
y = [10 20 30];
bar(x,y)
|
数据类型: single | double | int8 | int16 | int32 | int64 | uint8 | uint16 | uint32 | uint64 | duration
条形宽度,指定为可用于每个条形的总空间的一部分。默认值 0.8 表示条形宽度是从上一条形到下一条形之间的空间的 80%,两端各占该空间的 10%。
如果宽度为 1,则组中的条形紧挨在一起。
示例: bar([1 2 3],0.5) 创建使用 50% 可用空间的条形。
数据类型: single | double | int8 | int16 | int32 | int64 | uint8 | uint16 | uint32 | uint64
条形颜色,指定为下表中的选项之一。
| 颜色名称 | 短名称 | 外观 |
|---|---|---|
'red' | 'r' |
|
'green' | 'g' |
|
'blue' | 'b' |
|
'cyan' | 'c' |
|
'magenta' | 'm' |
|
'yellow' | 'y' |
|
'black' | 'k' |
|
'white' | 'w' |
|


包含要绘制的数据的源表,指定为表或时间表。
包含 x 坐标的表变量,使用下表中的索引方案之一指定。您指定的表变量可以包含数值、分类、日期时间、持续时间或字符串值。如果 xvar 和 yvar 都指定多个变量,则变量的数目必须相同。
| 索引方案 | 示例 |
|---|---|
变量名称:
|
|
变量索引:
|
|
变量类型:
|
|
示例: bar(tbl,["x1","x2"],"y") 为 x 坐标指定名为 x1 和 x2 的表变量,并为 y 坐标指定名为 y 的变量。
示例: bar(tbl,2,"y") 为 x 坐标指定第二个变量,并为 y 坐标指定名为 y 的变量。
示例: bar(tbl,vartype("numeric"),"y") 为 x 坐标指定所有数值变量,并为 y 坐标指定名为 y 的变量。
包含 y 坐标的表变量,使用下表中的索引方案之一指定。您指定的表变量可以包含数值或持续时间值。如果 xvar 和 yvar 都指定多个变量,则变量的数目必须相同。
| 索引方案 | 示例 |
|---|---|
变量名称:
|
|
变量索引:
|
|
变量类型:
|
|
示例: bar(tbl,"x",["y1","y2"]) 为 x 坐标指定名为 x 的表变量,并为 y 坐标指定名为 y1 和 y2 的表变量。
示例: bar(tbl,"x",2) 为 x 坐标指定名为 x 的表变量,并为 y 坐标指定第二个变量。
示例: bar(tbl,"x",vartype("numeric")) 为 x 坐标指定名为 x 的表变量,并为 y 坐标指定所有数值变量。
坐标区对象。如果您不指定坐标区,则 bar 使用条形图的当前坐标区。
名称-值参数
将可选参量对组指定为 Name1=Value1,...,NameN=ValueN,其中 Name 是参量名称,Value 是对应的值。名称-值参量必须出现在其他参量之后,但对各个参量对组的顺序没有要求。
如果使用的是 R2021a 之前的版本,请使用逗号分隔每个名称和值,并用引号将 Name 引起来。
示例: bar([10 20 30],'EdgeColor','g') 将围绕条形的轮廓指定为绿色。
此处所列的 Bar 属性只是一部分。有关完整列表,请参阅 Bar 属性。
对于自定义颜色,请指定 RGB 三元组或十六进制颜色代码。
RGB 三元组是包含三个元素的行向量,其元素分别指定颜色中红、绿、蓝分量的强度。强度值必须位于
[0,1]范围内,例如[0.4 0.6 0.7]。十六进制颜色代码是字符串标量或字符向量,以井号 (
#) 开头,后跟三个或六个十六进制数字,范围可以是0到F。这些值不区分大小写。因此,颜色代码"#FF8800"与"#ff8800"、"#F80"与"#f80"是等效的。
此外,还可以按名称指定一些常见的颜色。下表列出了一些命名颜色选项、其等效 RGB 三元组及十六进制颜色代码。
| 颜色名称 | 短名称 | RGB 三元组 | 十六进制颜色代码 | 外观 |
|---|---|---|---|---|
"red" | "r" | [1 0 0] | "#FF0000" |
|
"green" | "g" | [0 1 0] | "#00FF00" |
|
"blue" | "b" | [0 0 1] | "#0000FF" |
|
"cyan" | "c" | [0 1 1] | "#00FFFF" |
|
"magenta" | "m" | [1 0 1] | "#FF00FF" |
|
"yellow" | "y" | [1 1 0] | "#FFFF00" |
|
"black" | "k" | [0 0 0] | "#000000" |
|
"white" | "w" | [1 1 1] | "#FFFFFF" |
|
"none" | 不适用 | 不适用 | 不适用 | 无颜色 |
下表列出了浅色和深色主题中绘图的默认调色板。
| 调色板 | 调色板颜色 |
|---|---|
在 R2025a 之前的版本中: 大多数绘图默认使用这些颜色。 |
|
|
|


您可以使用 orderedcolors 和 rgb2hex 函数获取这些调色板的 RGB 三元组和十六进制颜色代码。例如,获取 "gem" 调色板的 RGB 三元组并将其转换为十六进制颜色代码。
RGB = orderedcolors("gem");
H = rgb2hex(RGB);
在 R2023b 之前的版本中: 使用 RGB = get(groot,"FactoryAxesColorOrder") 获取 RGB 三元组。
在 R2024a 之前的版本中: 使用 H = compose("#%02X%02X%02X",round(RGB*255)) 获取十六进制颜色代码。
示例: b = bar(1:10,'EdgeColor','red')
示例: b.EdgeColor = [0 0.5 0.5];
示例: b.EdgeColor = 'flat';
示例: b.EdgeColor = '#D2F9A7';
此外,还可以按名称指定一些常见的颜色。下表列出了一些命名颜色选项、其等效 RGB 三元组及十六进制颜色代码。
| 颜色名称 | 短名称 | RGB 三元组 | 十六进制颜色代码 | 外观 |
|---|---|---|---|---|
"red" | "r" | [1 0 0] | "#FF0000" |
|
"green" | "g" | [0 1 0] | "#00FF00" |
|
"blue" | "b" | [0 0 1] | "#0000FF" |
|
"cyan" | "c" | [0 1 1] | "#00FFFF" |
|
"magenta" | "m" | [1 0 1] | "#FF00FF" |
|
"yellow" | "y" | [1 1 0] | "#FFFF00" |
|
"black" | "k" | [0 0 0] | "#000000" |
|
"white" | "w" | [1 1 1] | "#FFFFFF" |
|
"none" | 不适用 | 不适用 | 不适用 | 无颜色 |
下表列出了浅色和深色主题中绘图的默认调色板。
| 调色板 | 调色板颜色 |
|---|---|
在 R2025a 之前的版本中: 大多数绘图默认使用这些颜色。 |
|
|
|
您可以使用 orderedcolors 和 rgb2hex 函数获取这些调色板的 RGB 三元组和十六进制颜色代码。例如,获取 "gem" 调色板的 RGB 三元组并将其转换为十六进制颜色代码。
RGB = orderedcolors("gem");
H = rgb2hex(RGB);
在 R2023b 之前的版本中: 使用 RGB = get(groot,"FactoryAxesColorOrder") 获取 RGB 三元组。
在 R2024a 之前的版本中: 使用 H = compose("#%02X%02X%02X",round(RGB*255)) 获取十六进制颜色代码。
从 R2017b 开始,默认值是来自坐标区的 ColorOrder 属性的一个 RGB 三元组。在以前的版本中,默认值为 'flat',且颜色基于颜色图。
示例: b = bar(1:10,'FaceColor','red')
示例: b.FaceColor = [0 0.5 0.5];
示例: b.FaceColor = 'flat';
示例: b.FaceColor = '#D2F9A7';
颜色数据,指定为下列值之一:
RGB 三元组 - 对所有条形应用同一个 RGB 颜色值。
三列矩阵 - 每个条形一种颜色。矩阵中的每一行指定一个特定条形的 RGB 三元组。
标量 - 对所有条形应用颜色图中的一种颜色。
向量 - 每个条形一种颜色。颜色来自颜色图。
默认情况下,当您创建条形图时,CData 属性包含一个由 RGB 三元组组成的三列矩阵。通过更改矩阵中的对应行,可以更改特定条形的颜色。
仅当 FaceColor 或 EdgeColor 属性设置为 'flat' 时,此属性才适用。
示例
通过将 FaceColor 属性设置为 'flat',更改特定条形的颜色。然后将 CData 矩阵中的对应行更改为新的 RGB 三元组。例如,更改第二个条形的颜色。
b = bar(1:10,'FaceColor','flat');
b.CData(2,:) = [0 0.8 0.8];

条形轮廓的线型,指定为此表中的线型之一。
| 线型 | 描述 | 表示的线条 |
|---|---|---|
"-" | 实线 |
|
"--" | 虚线 |
|
":" | 点线 |
|
"-." | 点划线 |
|
"none" | 无线条 | 无线条 |


