包含两个交互式绘图的图类
以下示例说明如何使用两个具有交互式功能的坐标区来定义一个类,以用于可视化时间表数据。顶部坐标区启用了沿 x 维度的平移和缩放,以便用户检查所关注的区域。底部坐标区在整个时间范围内显示绘图。底部坐标区还显示了一个浅蓝色的时间窗,指示顶部坐标区中的时间范围。该类定义了以下属性、方法和局部函数。
属性:
Data- 公共从属属性,用于存储时间表。TimeLimits- 公共属性,用于设置顶部坐标区的范围以及底部坐标区中时间窗的宽度。SavedData- 受保护属性,用户可以用它来保存和加载图实例并保留数据。TopAxes和BottomAxes- 私有属性,用于存储坐标区对象。TopLine和BottomLine- 私有属性,用于存储线对象。TimeWindow- 底部坐标区中显示的补片对象,用于指示顶部坐标区的时间范围。
方法:
set.Data和get.Data- 使用户能够保存和加载图实例并保留数据。setup- 在创建图时执行一次。它会配置布局和坐标区、线对象以及补片对象。update- 在setup方法之后以及用户更改图上一个或多个属性之后执行。panZoom- 当用户在顶部坐标区内平移或缩放时,更新图的时间范围。这会使时间窗更新,以反映新的范围。click- 当用户点击底部坐标区时,重新计算时间范围。
局部函数:
updateDataTipTemplate- 从update方法内部调用。它在数据提示中创建与时间表中的变量相对应的行。mustHaveOneNumericVariable- 验证Data属性。此函数可确保用户指定的时间表至少具有一个数值变量。
要定义该类,请将以下代码复制到编辑器中,并将其以名称 TimeTableChart.m 保存在可写文件夹中。
classdef TimeTableChart < matlab.graphics.chartcontainer.ChartContainer
    properties (Dependent)
        Data timetable {mustHaveOneNumericVariable} = ...
            timetable(datetime.empty(0,1),zeros(0,1))
    end

    properties
        TimeLimits (1,2) datetime = [NaT NaT]
    end

    properties (Access = protected)
        SavedData timetable = timetable(datetime.empty(0,1),zeros(0,1))
    end

    properties (Access = private, Transient, NonCopyable)
        TopAxes matlab.graphics.axis.Axes
        TopLine matlab.graphics.chart.primitive.Line
        BottomAxes matlab.graphics.axis.Axes
        BottomLine matlab.graphics.chart.primitive.Line
        TimeWindow matlab.graphics.primitive.Patch
    end

    methods
        function set.Data(obj, tbl)
            % Reset the time limits if the row times have changed.
            oldTimes = obj.SavedData.Properties.RowTimes;
            newTimes = tbl.Properties.RowTimes;
            if ~isequal(oldTimes, newTimes)
                obj.TimeLimits = [NaT NaT];
            end

            % Store the new table.
            obj.SavedData = tbl;
        end

        function tbl = get.Data(obj)
            tbl = obj.SavedData;
        end
    end

    methods (Access = protected)
        function setup(obj)
            % Create two axes. The top axes is 3x taller than bottom axes.
            tcl = getLayout(obj);
            tcl.GridSize = [4 1];
            obj.TopAxes = nexttile(tcl, 1, [3 1]);
            obj.BottomAxes = nexttile(tcl, 4);

            % Add a shared toolbar on the layout, which removes the
            % toolbar from the individual axes. Give the toolbar a typical
            % selection of buttons.
            axtoolbar(tcl, {'restoreview', 'zoom', 'pan', ...
                            'datacursor', 'export'});

            % Create one line to show the zoomed-in data.
            obj.TopLine = plot(obj.TopAxes, NaT, NaN);

            % Create one line to show an overview of the data, and disable
            % HitTest so the ButtonDownFcn on the bottom axes works.
            obj.BottomLine = plot(obj.BottomAxes, NaT, NaN, ...
                'HitTest', 'off');

            % Create a patch to show the current time limits.
            obj.TimeWindow = patch(obj.BottomAxes, ...
                'Faces', 1:4, ...
                'Vertices', NaN(4,2), ...
                'FaceColor', obj.TopLine.Color, ...
                'FaceAlpha', 0.3, ...
                'EdgeColor', 'none', ...
                'HitTest', 'off');

            % Constrain axes panning/zooming to only the X-dimension.
            obj.TopAxes.Interactions = [ ...
                dataTipInteraction;
                panInteraction('Dimensions','x');
                rulerPanInteraction('Dimensions','x');
                zoomInteraction('Dimensions','x')];

            % Disable pan/zoom on the bottom axes.
            obj.BottomAxes.Interactions = [];

            % Add a listener to XLim to respond to zoom events.
            addlistener(obj.TopAxes, 'XLim', 'PostSet', @(~, ~) panZoom(obj));

            % Add a callback for clicks on the bottom axes.
            obj.BottomAxes.ButtonDownFcn = @(~, ~) click(obj);
        end

        function update(obj)
            % Extract the time data from the table.
            tbl = obj.Data;
            t = tbl.Properties.RowTimes;

            % Extract the numeric variables from the table.
            S = vartype('numeric');
            numericTbl = tbl(:,S);

            % Update the data on both lines.
            set([obj.BottomLine obj.TopLine], 'XData', t, 'YData', numericTbl{:,1});

            % Create a dataTipTextRow for each variable in the timetable.
            updateDataTipTemplate(obj.TopLine, tbl)

            % Update the top axes limits.
            obj.TopAxes.YLimMode = 'auto';
            if obj.TimeLimits(1) < obj.TimeLimits(2)
                obj.TopAxes.XLim = obj.TimeLimits;
            else
                % Current time limits are invalid, so set XLimMode to auto and
                % let the axes calculate limits based on available data.
                obj.TopAxes.XLimMode = 'auto';
                obj.TimeLimits = obj.TopAxes.XLim;
            end

            % Update time window to reflect the new time limits.
            xLimits = ruler2num(obj.TimeLimits, obj.BottomAxes.XAxis);
            yLimits = obj.BottomAxes.YLim;
            obj.TimeWindow.Vertices = [xLimits([1 1 2 2]); yLimits([1 2 2 1])]';
        end

        function panZoom(obj)
            % When XLim on the top axes changes, update the time limits.
            obj.TimeLimits = obj.TopAxes.XLim;
        end

        function click(obj)
            % When clicking on the bottom axes, recenter the time limits.

            % Find the center of the click using CurrentPoint.
            center = obj.BottomAxes.CurrentPoint(1,1);

            % Convert from numeric units into datetime using num2ruler.
            center = num2ruler(center, obj.BottomAxes.XAxis);

            % Find the width of the current time limits.
            width = diff(obj.TimeLimits);

            % Recenter the current time limits.
            obj.TimeLimits = center + [-1 1]*width/2;
        end
    end
end

function updateDataTipTemplate(obj, tbl)

% Create a dataTipTextRow for each variable in the timetable.
timeVariable = tbl.Properties.DimensionNames{1};
rows = dataTipTextRow(timeVariable, tbl.(timeVariable));
for n = 1:numel(tbl.Properties.VariableNames)
    rows(n+1,1) = dataTipTextRow(...
        tbl.Properties.VariableNames{n}, tbl{:,n});
end
obj.DataTipTemplate.DataTipRows = rows;

end

function mustHaveOneNumericVariable(tbl)

% Validation function for Data property.
S = vartype('numeric');
if width(tbl(:,S)) < 1
    error('TimeTableChart:InvalidTable', ...
        'Table must have at least one numeric variable.')
end

end
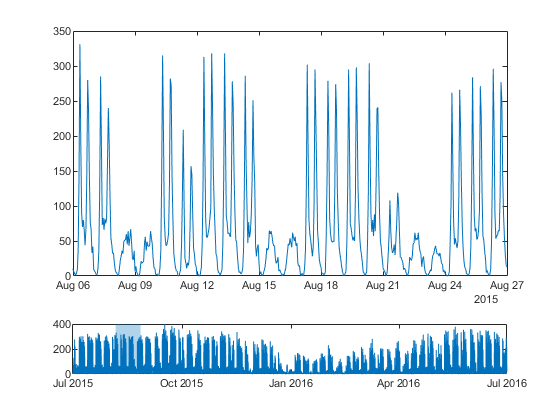
保存类文件后,创建图实例。在此例中,请使用该图来查看一年中某几周的自行车交通数据。
bikeTbl = readtimetable('BicycleCounts.csv');
bikeTbl = bikeTbl(169:8954,:);
tlimits = [datetime(2015,8,6) datetime(2015,8,27)];
TimeTableChart('Data',bikeTbl,'TimeLimits',tlimits);