创建包含极坐标区、地理坐标区或多个坐标区的图
对于作为 ChartContainer 基类的子类创建的图,getAxes 方法提供了一种方法来支持单个笛卡尔坐标区对象。如果要支持极坐标区、地理坐标区或多个坐标区,必须创建这些坐标区并将其配置为 TiledChartLayout 对象(该对象存储在图对象中)的子对象。
创建单个极坐标区或地理坐标区对象
要在图中包含单个极坐标区或地理坐标区对象:
定义一个私有属性来存储坐标区。
在
setup方法中:
例如,下面是一个包含极坐标区对象的基本类。
classdef SimplePolar < matlab.graphics.chartcontainer.ChartContainer
    properties(Access = private,Transient,NonCopyable)
        PolarAx matlab.graphics.axis.PolarAxes
    end

    methods(Access = protected)
        function setup(obj)
            % Get the layout and create the axes
            tcl = getLayout(obj);
            obj.PolarAx = polaraxes(tcl);

            % Other setup code
            % ...
        end
        function update(obj)
            % Update the chart
            % ...
        end
    end
end
创建多个坐标区对象的分块
要显示多个坐标区的分块,请:
定义存储坐标区对象的私有属性。您还可以定义一个属性,用于存储坐标区对象数组。
在
setup方法中:
例如,以下是一个包含两个笛卡尔坐标区的基本类:
classdef TwoAxesChart < matlab.graphics.chartcontainer.ChartContainer
    properties(Access = private,Transient,NonCopyable)
        Ax1 matlab.graphics.axis.Axes
        Ax2 matlab.graphics.axis.Axes
    end

    methods(Access = protected)
        function setup(obj)
            % Get the layout and set the grid size
            tcl = getLayout(obj);
            tcl.GridSize = [2 1];

            % Create the axes
            obj.Ax1 = axes(tcl);
            obj.Ax2 = axes(tcl);

            % Move the second axes to the second tile
            obj.Ax2.Layout.Tile = 2;
        end
        function update(obj)
            % Update the chart
            % ...
        end
    end
end
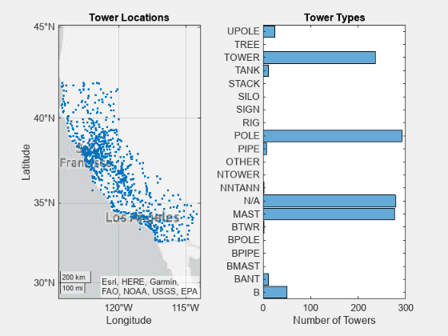
示例:包含地理坐标区和笛卡尔坐标区的图
以下示例说明了如何定义一个图类,以使用两个坐标区可视化地理和分类数据。左侧坐标区包含一幅地图,显示了多个蜂窝塔的位置。右侧坐标区按类别显示了这些塔的分布情况。
以下 TowerChart 类定义显示了如何:
定义一个名为
TowerData的用于存储表的公共属性。使用一个名为
mustHaveRequiredVariables的局部函数验证表的内容。定义两个私有属性
MapAxes和HistogramAxes,用于存储坐标区。实现
setup方法,用于获取TiledChartLayout对象,指定布局的网格大小,以及定位坐标区。
要定义该类,请将以下代码复制到编辑器中,并将其以名称 TowerChart.m 保存在可写文件夹中。
classdef TowerChart < matlab.graphics.chartcontainer.ChartContainer
    properties
        TowerData (:,:) table {mustHaveRequiredVariables} = table([],...
            [],[],'VariableNames',{'STRUCTYPE','Latitude','Longitude'})
    end

    properties (Access = private,Transient,NonCopyable)
        MapAxes matlab.graphics.axis.GeographicAxes
        HistogramAxes matlab.graphics.axis.Axes
        ScatterObject matlab.graphics.chart.primitive.Scatter
        HistogramObject matlab.graphics.chart.primitive.categorical.Histogram
    end

    methods (Access = protected)
        function setup(obj)
            % Configure layout and create axes
            tcl = getLayout(obj);
            tcl.GridSize = [1 2];
            obj.MapAxes = geoaxes(tcl);
            obj.HistogramAxes = axes(tcl);

            % Move histogram axes to second tile
            obj.HistogramAxes.Layout.Tile = 2;

            % Create Scatter and Histogram objects
            obj.ScatterObject = geoscatter(obj.MapAxes,NaN,NaN,'.');
            obj.HistogramObject = histogram(obj.HistogramAxes,categorical.empty,...
                'Orientation','horizontal');

            % Add titles to the axes
            title(obj.MapAxes,"Tower Locations")
            title(obj.HistogramAxes,"Tower Types")
            xlabel(obj.HistogramAxes,"Number of Towers")
        end

        function update(obj)
            % Update Scatter object
            obj.ScatterObject.LatitudeData = obj.TowerData.Latitude;
            obj.ScatterObject.LongitudeData = obj.TowerData.Longitude;

            % Get tower types from STRUCTYPE table variable
            towertypes = obj.TowerData.STRUCTYPE;

            % Check for empty towertypes before updating histogram
            if ~isempty(towertypes)
                obj.HistogramObject.Data = towertypes;
                obj.HistogramObject.Categories = categories(towertypes);
            else
                obj.HistogramObject.Data = categorical.empty;
            end
        end
    end
end

function mustHaveRequiredVariables(tbl)
% Return error if table does not have required variables
assert(all(ismember({'STRUCTYPE','Latitude','Longitude'},...
    tbl.Properties.VariableNames)),...
    'MATLAB:TowerChart:InvalidTable',...
    'Table must have STRUCTYPE, Latitude, and Longitude variables.');
end
保存类文件后,加载 cellularTowers.mat 中存储的表。然后通过将该表作为名称-值对组参量传递给 TowerChart 构造函数方法来创建图实例。
load cellularTowers.mat
TowerChart('TowerData',cellularTowers);