用于显示可变大小绘图分块的图类
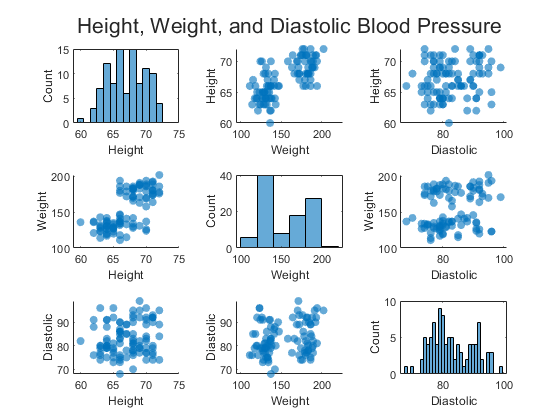
以下示例说明了如何定义一个类,用于创建可根据用户数据大小而定的任意大小的绘图分块。该图具有一个公共属性 Data,该属性接受 m×n 矩阵。该图显示了散点图和直方图的 n×n 方形分块。散点图显示了相对彼此而绘制的不同数据列。直方图显示了每个数据列中的值分布。
此类中的 update 方法会重新创建直方图和散点图,以反映数据中的变化。如果布局的网格大小与数据大小冲突,则删除所有坐标区,并更新 GridSize 属性以匹配数据大小。然后创建一组新的坐标区对象。
要定义该类,请将以下代码复制到编辑器中,并将其以名称 TrellisChart.m 保存在可写文件夹中。
classdef TrellisChart < matlab.graphics.chartcontainer.ChartContainer

    properties
        Data(:,:) {mustBeNumeric}
        ColNames(1,:) string
        TitleText(1,:) string
    end

    methods (Access = protected)
        function setup(obj)
            % Use one toolbar for all of the axes
            axtoolbar(getLayout(obj),{'restoreview','zoom', ...
			     'pan','datacursor','export'});
        end

        function update(obj)
            % Get the layout and store it as tcl
            tcl = getLayout(obj);
            numvars = size(obj.Data,2);

            % Reconfigure layout if needed
            if numvars ~= tcl.GridSize(1)
                % Delete layout contents to change the grid size
                delete(tcl.Children);
                if numvars>0
                    tcl.GridSize = [numvars numvars];
                    for i = 1:numvars^2
                        nexttile(tcl,i);
                    end
                end
            end

            % Populate the layout with the axes
            ax = gobjects(numvars,numvars);
            for col = 1:numvars
                for row = 1:numvars
                    % Get the axes at the current row/column
                    t = col + (row-1) * numvars;
                    ax(row,col)=nexttile(tcl,t);
                    if col==row
                        % On the diagonal, draw histograms
                        histogram(ax(row,col),obj.Data(:,col));
                        ylabel(ax(row,col),'Count')
                    else
                        % Off the diagonal, draw scatters
                        scatter(ax(row,col),obj.Data(:,col),...
                            obj.Data(:,row),'filled','MarkerFaceAlpha',0.6)
                        if length(obj.ColNames) >= row
                            ylabel(ax(row,col),obj.ColNames(row));
                        end
                    end

                    if length(obj.ColNames) >= col
                        xlabel(ax(row,col),obj.ColNames(col));
                    end
                end

                % Link the x-axis for each column, so that panning or zooming
                % affects all axes in the column.
                linkaxes(ax(:,col),'x')
            end

            % Chart title
            title(tcl,obj.TitleText,'FontSize',16);
        end
    end
end
保存类文件后,创建图实例。
load patients
chartTitle = "Height, Weight, and Diastolic Blood Pressure";
c = TrellisChart('Data',[Height Weight Diastolic], ...
    'colNames', ["Height" "Weight" "Diastolic"],...
    'TitleText',chartTitle);