通过叠加区域图来比较数据集
此示例演示如何通过叠加数据集区域图对比数据集。
叠加两个区域图
创建从 2004 到 2008 年的销售和支出数据。
years = 2004:2008;
sales = [51.6 82.4 90.8 59.1 47.0];
expenses = [19.3 34.2 61.4 50.5 29.4];
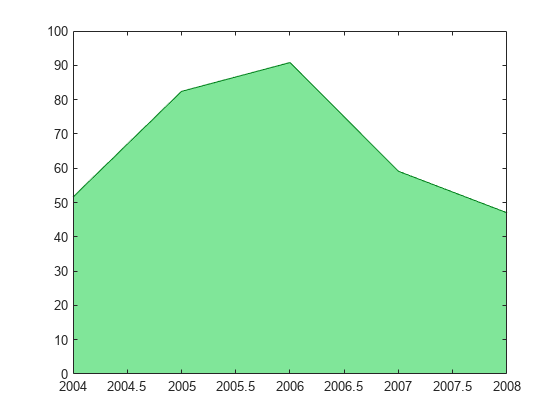
将销售和支出显示为同一套坐标区下两个单独的区域图。首先,绘制 sales 的区域图。通过使用 RGB 三元组颜色值设置 FaceColor 和 EdgeColor 属性,更改区域图的颜色。
area(years,sales,'FaceColor',[0.5 0.9 0.6],'EdgeColor',[0 0.5 0.1])

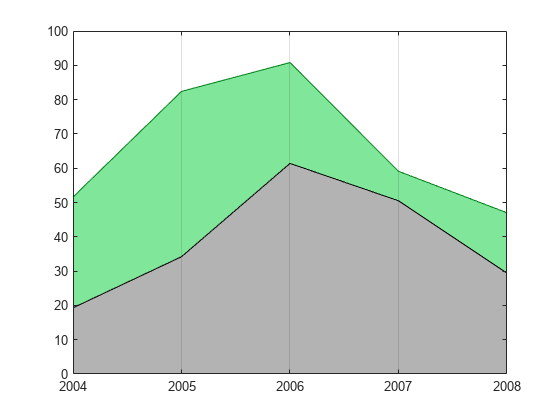
使用 hold 命令以防止新图形替换现有图形。绘制 expenses 的另一个区域图。然后,将 hold 状态重新设置为 off。
hold on
area(years,expenses,'FaceColor',[0.7 0.7 0.7],'EdgeColor','k')
hold off

添加网格线
沿 x 轴设置对应各个年份的刻度线。为每个刻度线绘制一条网格线。通过设置 Layer 属性,在区域图上显示网格线。使用圆点表示法设置属性。
ax = gca; % current axes
ax.XTick = years;
ax.XGrid = 'on';
ax.Layer = 'top';

添加标题、坐标轴标签和图例
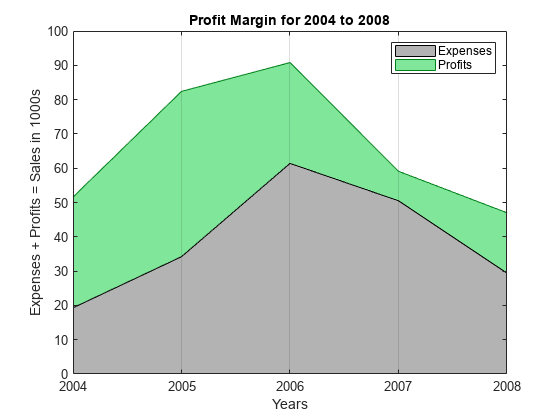
为图形提供标题,并添加轴标签。向图形添加图例以指示利润和支出区域。
title('Profit Margin for 2004 to 2008')
xlabel('Years')
ylabel('Expenses + Profits = Sales in 1000s')
legend('Profits','Expenses')
