Create Animations Using Latitude and Longitude Data
This example shows how to animate latitude and longitude data on a map by creating a comet plot, creating an animated line, and moving a marker along a line.
Load Data
Load a table containing cyclone track data [1]. Extract the latitude and longitude coordinates of the cyclone with ID 1013.
load cycloneTracks.mat
lat = cycloneTracks.Latitude(cycloneTracks.ID == 1013);
lon = cycloneTracks.Longitude(cycloneTracks.ID == 1013);
Create Comet Plot
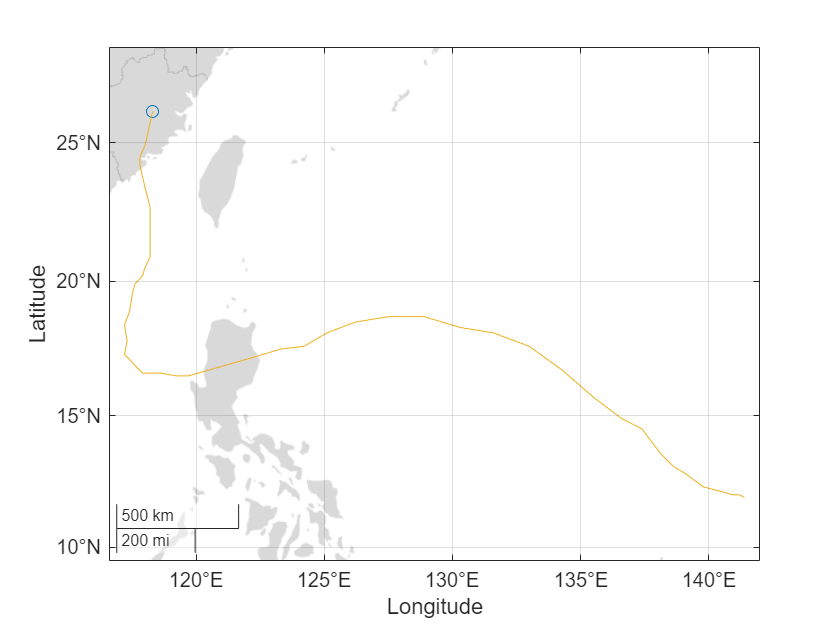
Create a comet plot by using the comet function. A comet plot animates a sequence of data points by using a marker for the current data point and a line for the previous data points.
Create a geographic axes that uses the grayland basemap. Then, create a comet plot from the coordinates. Specify the geographic axes as input to the comet function.
figure
geobasemap grayland

gxComet = gca;
comet(gxComet,lat,lon)
Create Animated Line
Create an animated line by using the animatedline function, and add points to the line by using the addpoints function. Export the animation to a GIF by using the exportgraphics function.
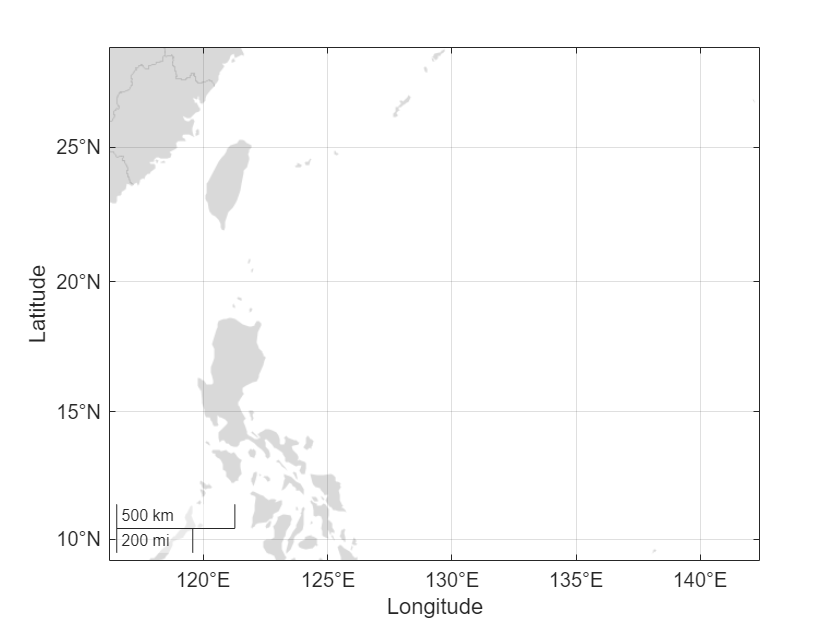
Create a new geographic axes that uses the grayland basemap. Set the geographic limits using the bounds of the coordinates.
figure
geobasemap grayland

[latmin,latmax] = bounds(lat);
[lonmin,lonmax] = bounds(lon);
geolimits([latmin latmax],[lonmin-1 lonmax+1])
Create the initial animated line by passing the geographic axes to the animatedline function. Then, animate the line by adding the coordinates in a loop. Capture each addition as a frame in an animated GIF.
gxLine = gca;
an = animatedline(gxLine);

for k = 1:length(lat)
    addpoints(an,lat(k),lon(k))
    exportgraphics(gxLine,"cycloneLine.gif",Append=true)
end

Trace Marker Along Line
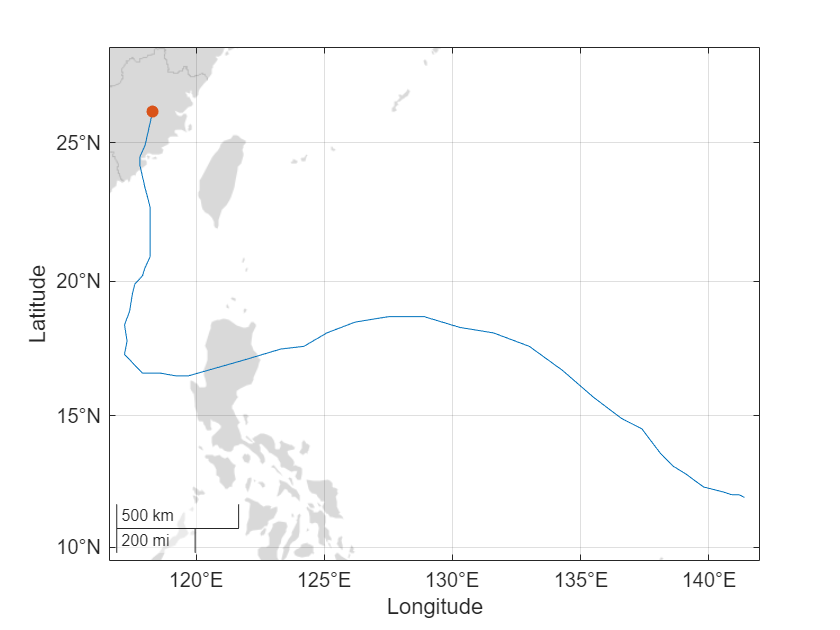
Trace a marker along a line by updating the data properties of the marker. Export the animation to a GIF by using the exportgraphics function.
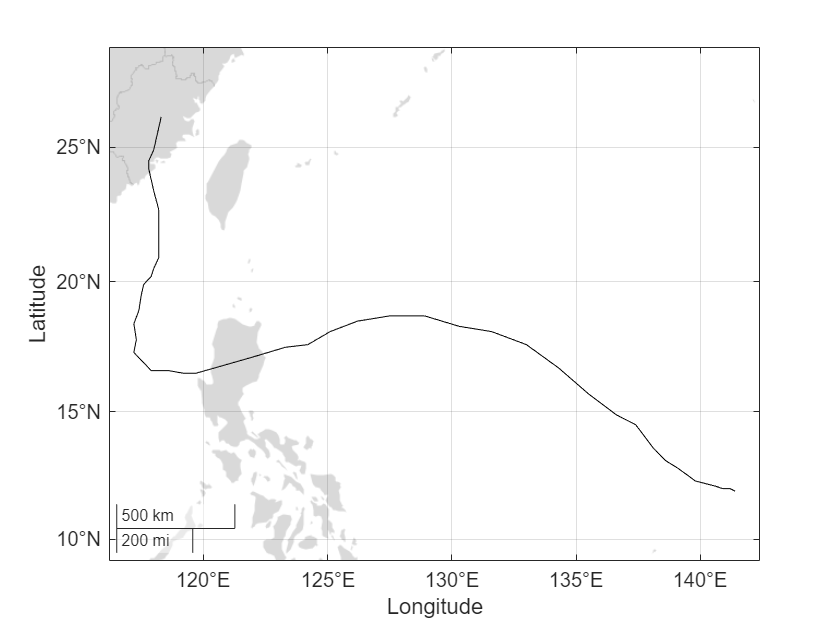
Create a new geographic axes that uses the grayland basemap. Create a line from the coordinates by using the geoplot function. Prepare to plot additional data by setting the hold state of the axes to on.
figure
geobasemap grayland
geoplot(lat,lon)
hold on
Create a marker from the first point by using the geoscatter function. Return the Scatter object in s.
s = geoscatter(lat(1),lon(1),"filled");Move the marker along the line by updating the LatitudeData and LongitudeData properties of the Scatter object in a loop. Capture each change as a frame in an animated GIF.
gxMarker = gca;
for k = 1:length(lat)
    s.LatitudeData = lat(k);
    s.LongitudeData = lon(k);
    exportgraphics(gxMarker,"cycloneMarker.gif",Append=true)
end

[1] This example uses modified RSMC Best Track Data from the Japan Meteorological Agency.
See Also
Functions
comet|animatedline|addpoints|geoplot|geoscatter|exportgraphics