使用平行坐标图探索表数据
此示例显示如何将文件以表的形式导入 MATLAB®,从表格数据创建平行坐标图,以及修改绘图的外观。
平行坐标图适用于可视化具有多个列的表格或矩阵数据。输入数据的行对应于绘图中的线条,输入数据的列对应于绘图中的坐标轴。您可以将绘图中的线条进行分组,以便更好地查看数据中的趋势。
以表的形式导入文件
加载示例文件 TemperatureData.csv,此文件包含 2015 年 1 月至 2016 年 7 月间的日均温度。将此文件读取到一个表中,并显示前几行。
tbl = readtable('TemperatureData.csv');
head(tbl)
Year Month Day TemperatureF
____ ___________ ___ ____________
2015 {'January'} 1 23
2015 {'January'} 2 31
2015 {'January'} 3 25
2015 {'January'} 4 39
2015 {'January'} 5 29
2015 {'January'} 6 12
2015 {'January'} 7 10
2015 {'January'} 8 4
创建基本的平行坐标图
用表的前几行数据创建一个平行坐标图。绘图中的每个线条对应于表中的一行。默认情况下,parallelplot 会按照所有坐标变量在表中出现的顺序显示这些坐标变量。软件将在坐标标尺下方显示相应的坐标变量名称。
该绘图显示,表的前 8 行提供了 2015 年 1 月前 8 天的温度数据。例如,就日均温度而言,第 8 天是这 8 天中最寒冷的一天。
parallelplot(head(tbl))

为了帮助您解读绘图,默认情况下,MATLAB 会在绘图中沿坐标标尺随机抖动线条,使其不会完全重叠。例如,虽然前 8 个观测值具有相同的 Year 和 Month 值,但图中的线并没有完全对齐到 Year 坐标标尺的 2015 刻度线处,也没有完全对齐到 Month 坐标标尺的 January 刻度线处。虽然抖动会影响所有坐标变量,但它通常在分类坐标标尺上更加明显,因为抖动量取决于刻度线之间的距离。您可以设置 Jitter 属性来控制绘图中的抖动量。
请注意,Year 坐标标尺上的一些刻度线是无意义的十进制值。为确保坐标标尺上的刻度线仅对应有意义的值,您可以使用 categorical 函数将变量转换为分类变量。
tbl.Year = categorical(tbl.Year);
现在用整个表的数据创建一个平行坐标图。将 ParallelCoordinatesPlot 对象赋给变量 p,以便在创建绘图后使用 p 进行修改。例如,使用 Title 属性为绘图添加标题。
p = parallelplot(tbl)
p =
  ParallelCoordinatesPlot with properties:

            SourceTable: [565×4 table]
    CoordinateVariables: {'Year'  'Month'  'Day'  'TemperatureF'}
          GroupVariable: ''

  Show all properties
p.Title = 'Temperature Data';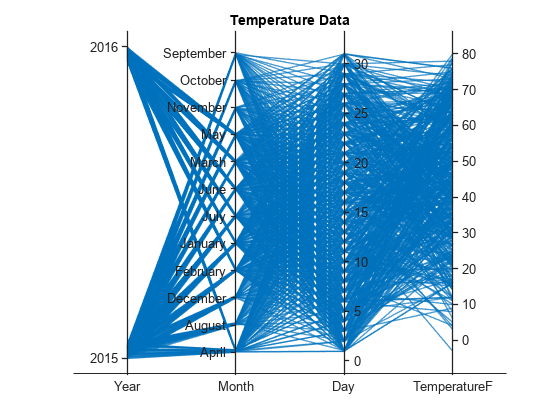
对绘图线条分组
通过设置 GroupVariable 属性,根据 Year 值对绘图中的线条进行分组。默认情况下,MATLAB 会在绘图中添加一个图例。可以通过将 LegendVisible 属性设置为 'off' 来删除该图例。
p.GroupVariable = 'Year';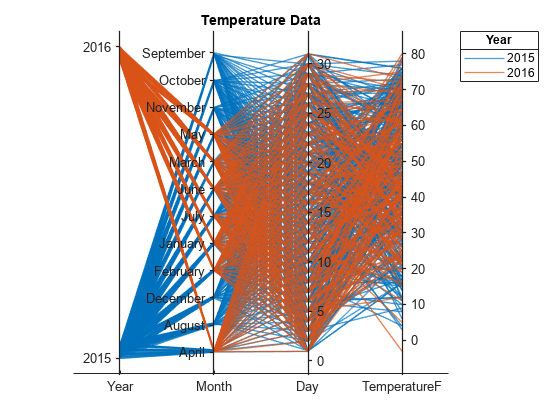
交互式重排坐标变量
以交互方式重新排列坐标变量,以便更轻松地比较它们,并决定在绘图中保留哪些变量。
在图窗窗口中打开您的绘图。点击坐标刻度标签,并将关联的坐标标尺拖到您选择的位置。软件用一个黑色矩形来突出显示所选坐标标尺。例如,您可以点击 Month 坐标刻度标签,然后向右拖动坐标标尺。然后,您可以轻松比较 Month 和 TemperatureF 的值。

当您以交互方式重新排列坐标变量时,软件会更新绘图的相关 CoordinateTickLabels、CoordinateVariables 和 CoordinateData 属性。
有关更多交互选项,请参阅提示。
选择部分坐标变量
显示 p.SourceTable 中的部分坐标变量,并通过设置 p 的 CoordinateVariables 属性来指定它们在绘图中的顺序。
具体操作是从绘图中删除 Day 变量,并将 TemperatureF 变量(源表中的第四列)显示为绘图中的第二个坐标轴。
p.CoordinateVariables = [1 4 2];
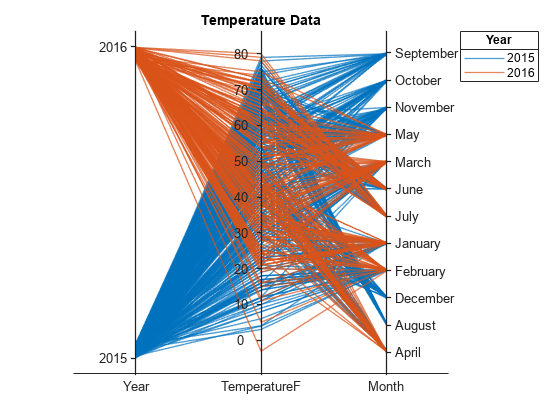
您还可以通过下列方法设置 CoordinateVariables 属性:变量名称的字符串或元胞数组,或者以 true 元素表示选定变量的逻辑向量。
修改坐标变量中的类别
在绘图中显示 Month 中类别的一个子集,并更改坐标标尺上的类别顺序。
由于一些月份仅包含两年中的一年的数据,因此需要删除源表中与这些月份对应的行。MATLAB 会在源表更改后立即更新绘图。
uniqueMonth = {'September','October','November','December','August'};
uniqueMonthIdx = ismember(p.SourceTable.Month,uniqueMonth);
p.SourceTable(uniqueMonthIdx,:) = [];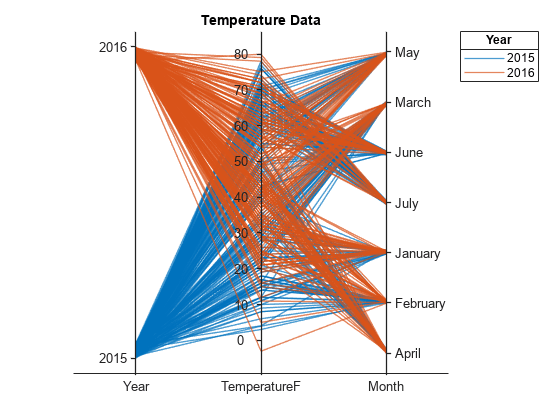
通过更新源表,按时间顺序在 Month 坐标标尺上排列月份。
categoricalMonth = categorical(p.SourceTable.Month);
newOrder = {'January','February','March','April','May','June','July'};
orderMonth = reordercats(categoricalMonth,newOrder);
p.SourceTable.Month = orderMonth;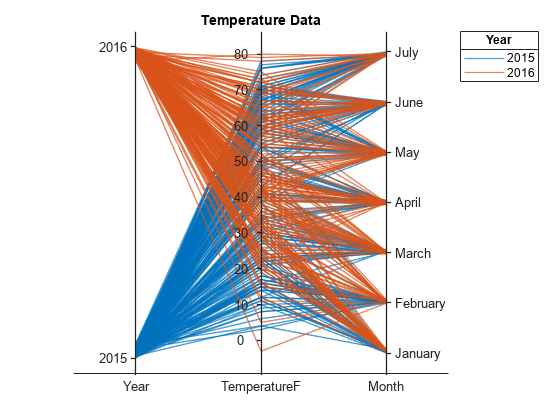
基于分 bin 后的值对绘图线条分组
为了更好地可视化每个月内的温度范围,您可以使用 discretize 来对温度数据分 bin,并使用分 bin 后的值对绘图中的线条进行分组。查看源表中的最低和最高温度。设置 bin 边界,将这些值包含在内。
min(p.SourceTable.TemperatureF)
ans =
-3
max(p.SourceTable.TemperatureF)
ans =
80
binEdges = [-3 10:10:80];
bins = {'00s+/-','10s','20s','30s','40s','50s','60s','70s+'};
groupTemperature = discretize(p.SourceTable.TemperatureF, ...
    binEdges,'categorical',bins);
将分 bin 后的温度添加到源表中。根据分 bin 后的温度数据,对绘图中的线条进行分组。
p.SourceTable.GroupTemperature = groupTemperature;
p.GroupVariable = 'GroupTemperature';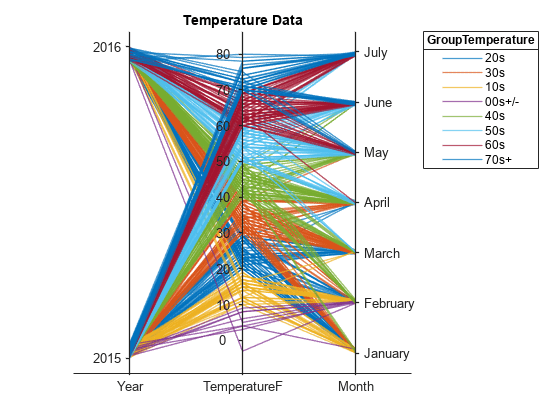
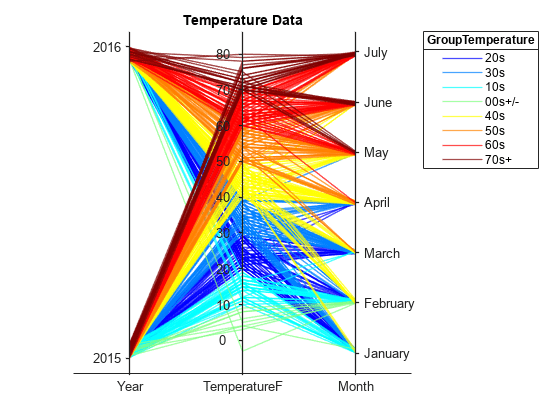
由于 GroupTemperature 包含的类别超过 7 个,因此绘图中的一些组具有相同的颜色。通过设置 Color 属性,为每个组指定不同的颜色。
p.Color = jet(8);
另请参阅
函数
parallelplot|table|readtable|reordercats|categorical|discretize