使用 newplot 控制绘图
此示例说明如何为用户编写的绘图函数准备坐标区。使用圆点表示法设置属性。
使用 newplot 管理指定绘图函数输出。myPlot2D 函数:
针对多线图循环使用线型和单一颜色。
添加具有指定显示名称的图例。
function myPlot2D(x,y)
   % Call newplot to get the axes object
   cax = newplot;
   % Customize axes
   cax.FontName = 'Times';
   cax.FontAngle = 'italic';

   % Create plot
   hLines = line(x,y,...
      'Color',[.5,.5,.5],...
      'LineWidth',2);
   lso = ['- ';'--';': ';'-.'];
   setLineStyle(hLines)
   grid on
   legend('show','Location','SouthEast')

   function setLineStyle(hLines)
      style = 1;
      for ii = 1:length(hLines)
         if style > length(lso)
            style = 1;
         end
         hLines(ii).LineStyle = lso(style,:);
         hLines(ii).DisplayName = num2str(style);
         style = style + 1;
      end
   end
end
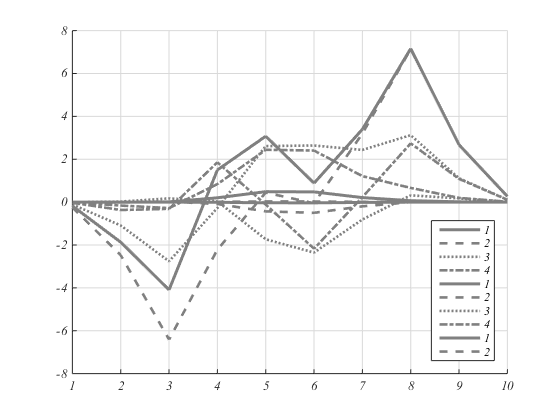
此图显示 myPlot2D 函数的典型输出:
x = 1:10;
y = peaks(10);
myPlot2D(x,y)
myPlot2D 函数显示用户编写的绘图函数的基本结构:
由于 myPlot2D 使用 newplot 返回的坐标区对象访问目标坐标区,此函数:
在使用各后续调用清空坐标区时遵循 MATLAB® 绘图函数的行为。
在
hold设置为on时,工作正常。
NextPlot 属性的默认设置确保您的绘图函数遵循标准 MATLAB 行为 - 重用图窗窗口,但不清空和重置每个新图的坐标区。